Comparative Study
. 2012 Feb 15;59(4):3889-900.
doi: 10.1016/j.neuroimage.2011.11.035. Epub 2011 Nov 18.

The discovery of population differences in network community structure: new methods and applications to brain functional networks in schizophrenia

Affiliations
Comparative Study

The discovery of population differences in network community structure: new methods and applications to brain functional networks in schizophrenia

Aaron Alexander-Bloch et al. Neuroimage. .

Abstract

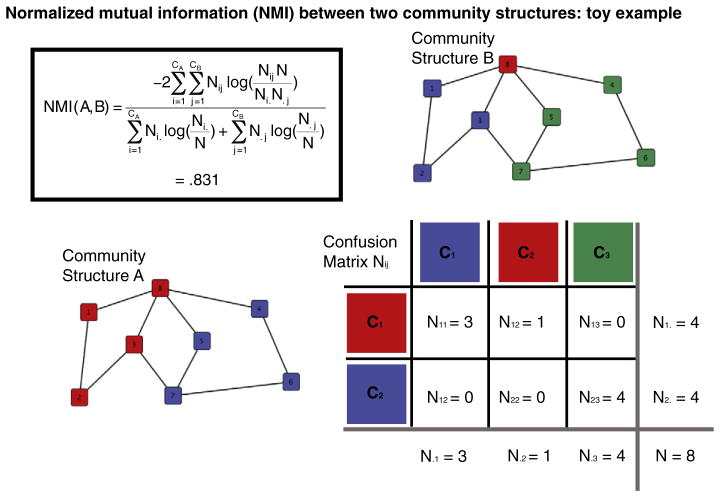
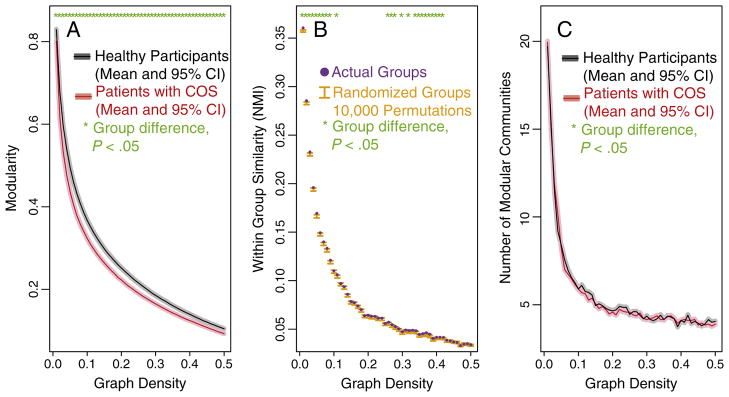
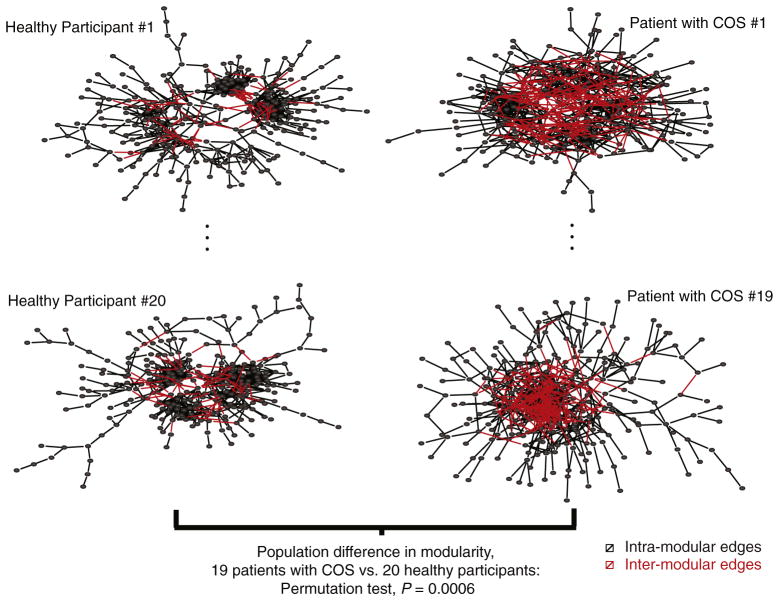
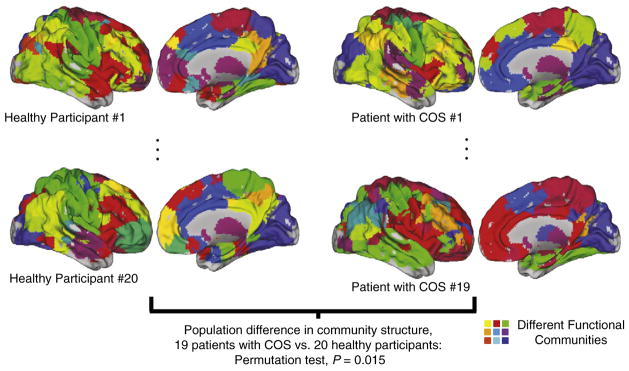
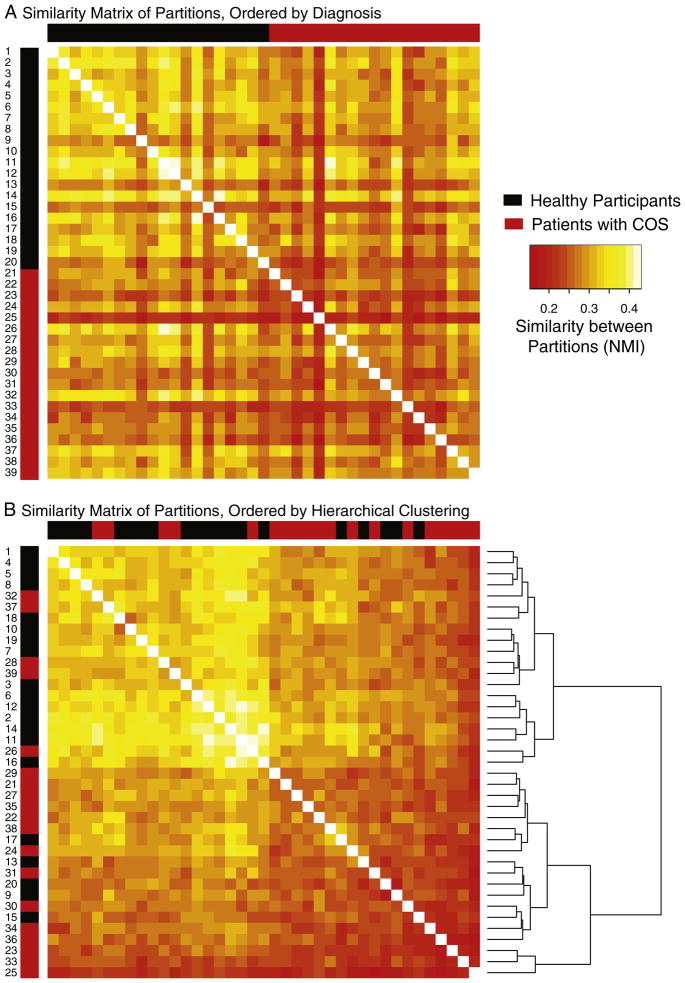
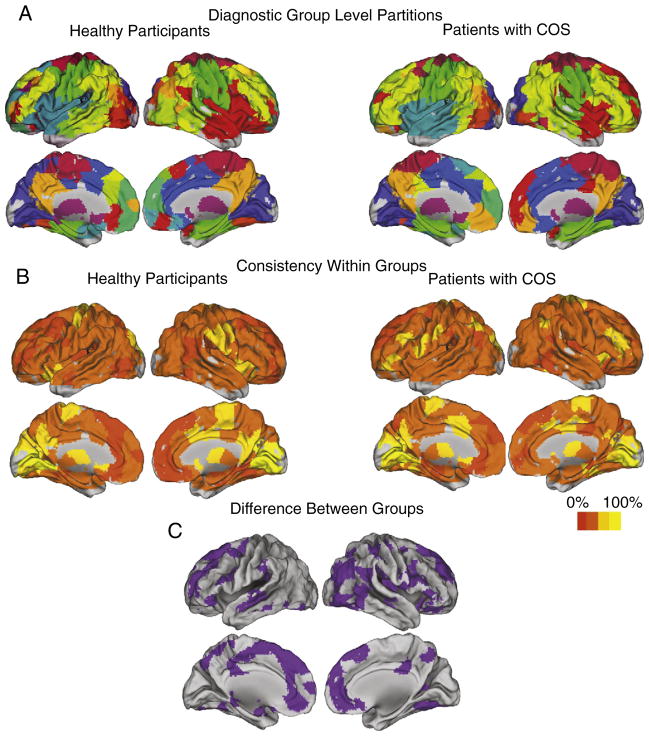
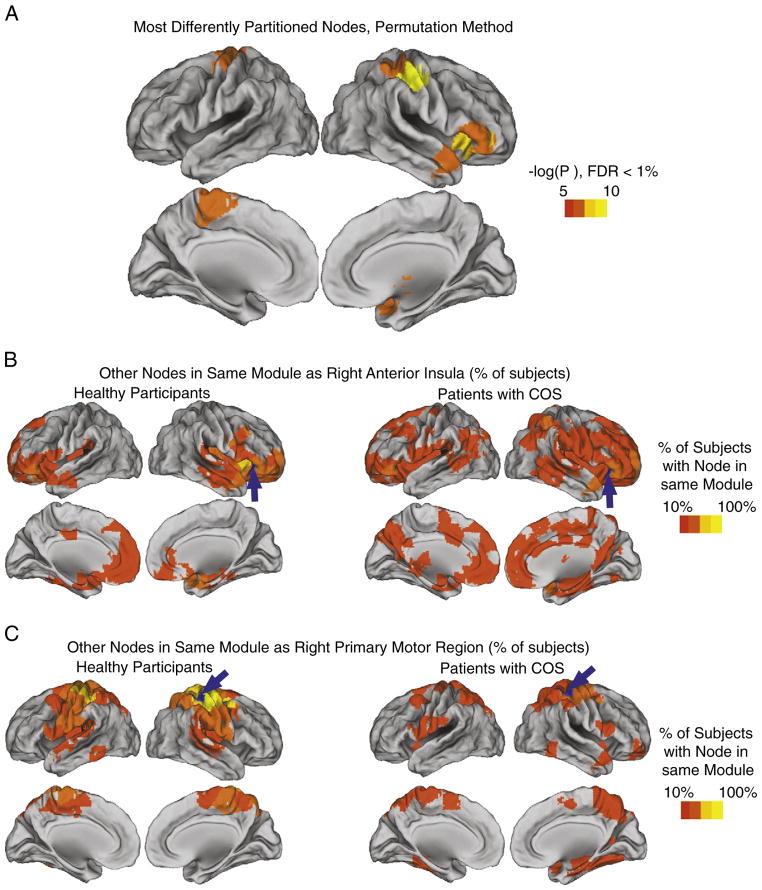
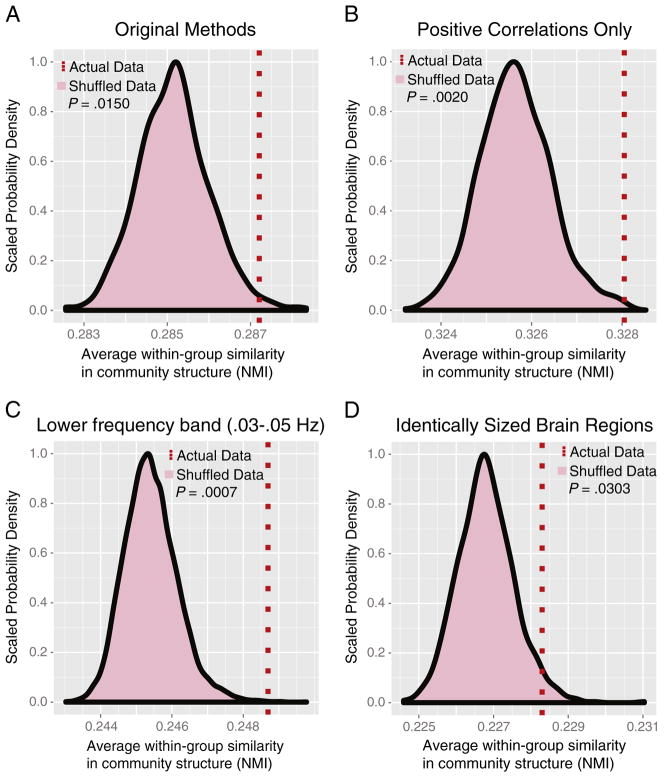
The modular organization of the brain network can vary in two fundamental ways. The amount of inter- versus intra-modular connections between network nodes can be altered, or the community structure itself can be perturbed, in terms of which nodes belong to which modules (or communities). Alterations have previously been reported in modularity, which is a function of the proportion of intra-modular edges over all modules in the network. For example, we have reported that modularity is decreased in functional brain networks in schizophrenia: There are proportionally more inter-modular edges and fewer intra-modular edges. However, despite numerous and increasing studies of brain modular organization, it is not known how to test for differences in the community structure, i.e., the assignment of regional nodes to specific modules. Here, we introduce a method based on the normalized mutual information between pairs of modular networks to show that the community structure of the brain network is significantly altered in schizophrenia, using resting-state fMRI in 19 participants with childhood-onset schizophrenia and 20 healthy participants. We also develop tools to show which specific nodes (or brain regions) have significantly different modular communities between groups, a subset that includes right insular and perisylvian cortical regions. The methods that we propose are broadly applicable to other experimental contexts, both in neuroimaging and other areas of network science.


Figures

Fig. 1
Fig. 1. An illustration of the normalized mutual information (NMI) between two community structures, using toy networks
In the NMI equation, CA is the number of communities in structure A, and CB is the number of communities in structure B; the “confusion” matrix, Nij, measures the overlap between A’s community Ci and B’s community Cj; Ni. is the number of nodes in Ci; N.j is the total number of nodes in Cj; and N is the total number of nodes over all communities. NMI(A,B) tends to be high when the N nodes are concentrated in a small number of entries in the confusion matrix. Note that NMI is not affected by the community labels, i.e., the numbers or colors corresponding to the specific communities, but matching the labels between networks is important for visual comparisons.
Fig. 2
Fig. 2. Group differences in modularity and community structure
There is a significant difference in both modularity (A) and the community structure (B) of brain functional networks estimated from fMRI data on healthy participants and patients with childhood-onset schizophrenia (COS). A) For the full range of connection densities from 1% to 50%, the COS patients have decreased modularity. B) Over a more limited range that includes sparse networks thresholded at 1–10% connection density, there is a significant difference between the groups’ community structures, as assessed by the within-group similarity of the real data and permuted data. C) There is no significant difference in the number of modular communities, between the healthy participants and the COS patients.
Fig. 3
Fig. 3. Group difference in modularity
The group difference in modularity is illustrated with sparse graphs that include 2% of all possible edges, with the graphs represented in topological space using a forced-based algorithm (Fruchterman and Reingold, 1991), for two subjects in each clinical sample. Black edges represent intra-modular connections, between brain regions in the same functional community. Red edges represent inter-modular connections, between brain regions in different functional communities. On average there are more inter-modular connections and less intra-modular connections in the networks of patients with childhood-onset schizophrenia (COS) compared to healthy participants. The P value is based on a permutation test of the difference in modularity at the population level, 20 healthy participants vs. 19 patients with COS. For a version of this figure with the different modules demarcated by colors, please see Supplementary Fig. 1.
Fig. 4
Fig. 4. Group difference in the community structure
The group difference in community structure, or the assignment of brain regions to modules, is illustrated with the modules of sparse graphs that include 2% of all possible edges, for two subjects in each clinical sample. The different functional modules are painted with different colors, with the colors between subjects algorithmically matched (see Materials and methods). The within-group community assignments are, on average, more similar than the between-group community assignments. CARET software (Van Essen et al., 2001) has been used to display the images. The P value is based on a permutation test of the difference in the community structure at the population level, 20 healthy participants vs. 19 patients with COS.
Fig. 5
Fig. 5. The similarity of each pair of subjects’ community structures, between and within clinical groups
Each element in the similarity matrix represents the normalized mutual information (NMI) measure of similarity between a pair of brain modular assignments like those illustrated in Fig. 4, although note that the NMI does not depend on the color-matching algorithm used for that figure. A) The layout of the similarity matrix is ordered only by clinical group, with the first 20 rows/columns (starting in the top right corner) representing healthy participants and the last 19 representing patients with schizophrenia. B) The same similarity matrix, except with the layout determined by complete linkage hierarchical clustering. Approximately 75% of the subjects are correctly classified into their actual groups using this unsupervised learning approach, signifying that the modular partitions contain information about diagnostic category.
Fig. 6
Fig. 6. Group level community structurs and the difference between clinical samples
A) The group-level community structures for each clinical population (20 healthy participants, 19 patients with schizophrenia). The color labels are determined by the most frequent label across all of the subjects, after they have been algorithmically matched by maximizing the overlap between all subjects and the single most representative subject as determined by average NMI. B) The consistency of the assignment of brain regions to modules, within each group. It is clear that our confidence in these assignments differs across nodes, with the greatest confidence in the modular assignment of subcortical areas, primary sensory areas and primary motor areas. C) The differences between the group-level community structures of the two clinical samples.
Fig. 7
Fig. 7. Statistically significant differences in the community structure of specific nodes, between groups
A) Regions displayed have significantly different communities between the healthy participants and the patients with childhood-onset schizophrenia (COS), in terms of the other brain regions that are found in the same module, as tested via a permutation procedure (see Materials and methods). All P values remain significant after correction for multiple comparisons, using a false discovery rate cutoff of 1%. The communities of two of these regions are illustrated, in both the healthy participants and the patients with COS, for B) a region in the right anterior insula and C) a region in right primary motor cortex.
Fig. 8
Fig. 8. Robustness of group difference in community structure to methodological variation
A) The original methods: functional connectivity is defined as the absolute wavelet correlation at scale 2 (0.05–0.11 Hz), and anatomical regions were defined in order to maximize compactness while allowing some variation in volume (2128 mm3–4256 mm3). B) Only positive correlations included in the networks. C) Scale 3 frequency band (0.03–0.05 Hz). D) Regions constrained to be exactly the same size (1600 mm3). Permutation tests were conducted on sparse, 2% thresholded networks using 10,000 random permutations.

References

    1. Alexander-Bloch AF, Gogtay N, Meunier D, Birn R, Clasen L, et al. Disrupted modularity and local connectivity of brain functional networks in childhood-onset schizophrenia. Front Sys Neurosci. 2010;4:147. - PMC - PubMed
    1. Bassett DS, Bullmore E, Verchinski BA, Mattay VS, Weinberger DR, et al. Hierarchical organization of human cortical networks in health and schizophrenia. J Neurosci. 2008;28:9239–9248. - PMC - PubMed
    1. Bassett DS, Bullmore ET, Meyer-Lindenberg A, Apud JA, Weinberger DR, et al. Cognitive fitness of cost-efficient brain functional networks. Proc Natl Acad Sci U S A. 2009;106:11747–11752. - PMC - PubMed
    1. Bassett DS, Greenfield DL, Meyer-Lindenberg A, Weinberger DR, Moore SW, et al. Efficient physical embedding of topologically complex information processing networks in brains and computer circuits. PLoS Comput Biol. 2010;6:e1000748. - PMC - PubMed
    1. Bellec P, Perlbarg V, Jbabdi S, Pélégrini-Issac M, Anton JL, et al. Identification of large-scale networks in the brain using fMRI. Neuroimage. 2006;29:1231–1243. - PubMed

Publication types