

doi: 10.1038/ng.993.
Common variation at 3p22.1 and 7p15.3 influences multiple myeloma risk
Affiliations
- PMID: 22120009
- PMCID: PMC5108406
- DOI: 10.1038/ng.993
Item in Clipboard
Common variation at 3p22.1 and 7p15.3 influences multiple myeloma risk
Nat Genet.
.
Abstract
To identify risk variants for multiple myeloma, we conducted a genome-wide association study of 1,675 individuals with multiple myeloma and 5,903 control subjects. We identified risk loci for multiple myeloma at 3p22.1 (rs1052501 in ULK4; odds ratio (OR) = 1.32; P = 7.47 × 10(-9)) and 7p15.3 (rs4487645, OR = 1.38; P = 3.33 × 10(-15)). In addition, we observed a promising association at 2p23.3 (rs6746082, OR = 1.29; P = 1.22 × 10(-7)). Our study identifies new genomic regions associated with multiple myeloma risk that may lead to new etiological insights.
Conflict of interest statement
Statement The authors declare no competing financial interests.
Figures
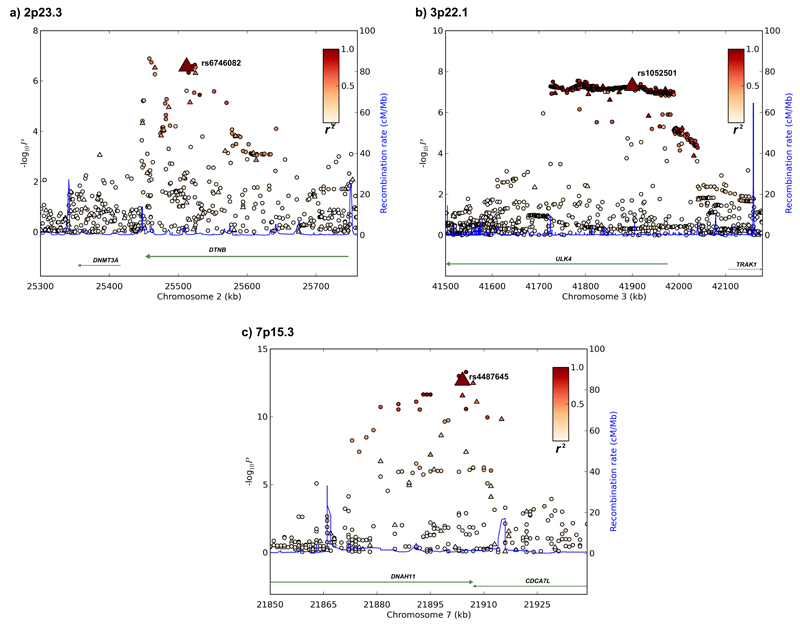
(a-c) Association results of both genotyped (triangles) and imputed (circles) SNPs in the GWAS samples and recombination rates within the loci: (a) 2p23.3, (b) 3p22.1, (b) 7p15.3. For each plot, −log10
P values (y axis) of the SNPs are shown according to their chromosomal positions (x axis). The top genotyped SNP in each combined analysis is a large triangle and is labeled by its rsID. The color intensity of each symbol reflects the extent of LD with the top genotyped SNP: white (r2=0) through to dark red (r2=1.0). Genetic recombination rates (cM/Mb), estimated using HapMap CEU samples, are shown with a light blue line. Physical positions are based on NCBI build 36 of the human genome. Also shown are the relative positions of genes and transcripts mapping to each region of association. Genes have been redrawn to show the relative positions; therefore, maps are not to physical scale.
References
-
- Kyle RA, Rajkumar SV. Multiple myeloma. N Engl J Med. 2004;351:1860–73. - PubMed
-
- Palumbo A, Anderson K. Multiple myeloma. N Engl J Med. 2011;364:1046–60. - PubMed
-
- Kyle RA, et al. A long-term study of prognosis in monoclonal gammopathy of undetermined significance. N Engl J Med. 2002;346:564–9. - PubMed
-
- Altieri A, Chen B, Bermejo JL, Castro F, Hemminki K. Familial risks and temporal incidence trends of multiple myeloma. Eur J Cancer. 2006;42:1661–70. - PubMed
Publication types
MeSH terms
Substances
Grants and funding
LinkOut - more resources
Full Text Sources
Medical
