Review
. 2012 Jun;61(2):324-41.
doi: 10.1016/j.neuroimage.2011.11.006. Epub 2011 Nov 20.

Diffusion MRI at 25: exploring brain tissue structure and function

Affiliations
Review

Diffusion MRI at 25: exploring brain tissue structure and function

Denis Le Bihan et al. Neuroimage. 2012 Jun.

Abstract

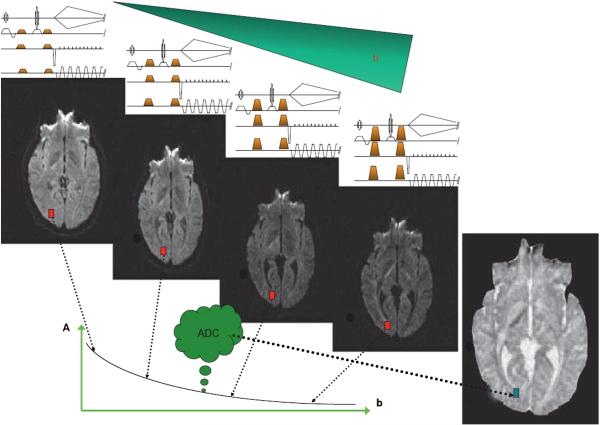
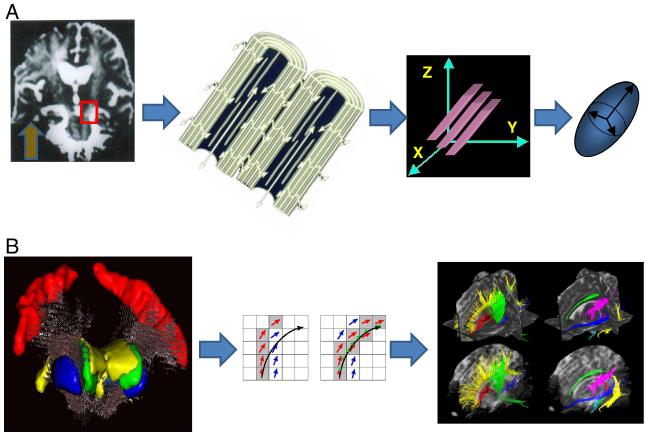
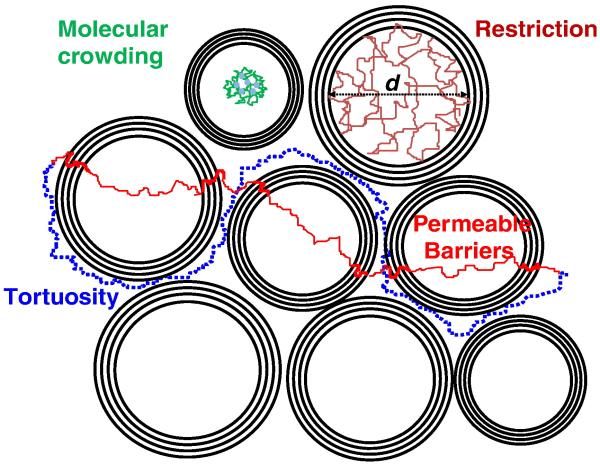
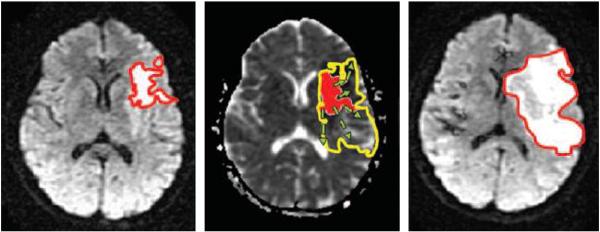
Diffusion MRI (or dMRI) came into existence in the mid-1980s. During the last 25 years, diffusion MRI has been extraordinarily successful (with more than 300,000 entries on Google Scholar for diffusion MRI). Its main clinical domain of application has been neurological disorders, especially for the management of patients with acute stroke. It is also rapidly becoming a standard for white matter disorders, as diffusion tensor imaging (DTI) can reveal abnormalities in white matter fiber structure and provide outstanding maps of brain connectivity. The ability to visualize anatomical connections between different parts of the brain, non-invasively and on an individual basis, has emerged as a major breakthrough for neurosciences. The driving force of dMRI is to monitor microscopic, natural displacements of water molecules that occur in brain tissues as part of the physical diffusion process. Water molecules are thus used as a probe that can reveal microscopic details about tissue architecture, either normal or in a diseased state.


Figures

Fig. 1
Fig. 1
Diffusion-weighted and diffusion-calculated (ADC) images. The set of diffusion-weighted images is obtained using different b-values, by changing the intensity of the diffusion gradient pulses (gold trapezoids) in the MRI sequence. In diffusion-weighted images, the overall signal intensity in each voxel decreases with the b-value. Tissues with high diffusion (such as ventricles) get darker more rapidly when the b-value is increased and become black. Tissues with low diffusion remain with a higher signal. As diffusion-weighted images also contain T1 and T2 contrast, one may want to calculate pure diffusion (or ADC) images. To do so, the variation of the signal intensity, A(x, y, z), of each voxel (red boxes) with the b-value is fitted using Eq. (3) to estimate the ADC for each voxel (green box). In the resulting image, the contrast is inverted: bright corresponds to fast diffusion and dark to low diffusion.
Fig. 2
Fig. 2
Diffusion anisotropy and diffusion tensor imaging. In the presence of anisotropic diffusion the ADC, as in white matter, depends on the measurement direction. A left to right: Measurement direction was vertical (yellow arrow). Vertical tracts (such as pyramidal tract) have high ADC, while horizontal tracts (as in corpus callosum) are dark. This results from the fact that diffusion is reduced perpendicularly to the white matter fibers due the presence of plasma membranes and myelin. With Diffusion Tensor Imaging it becomes possible to characterize diffusion in all 3 dimensions and to determine the direction of fastest diffusion. For each image voxel an ellipsoid can be produced the nature of which is related to key DTI parameters: overall ellipsoid volume and mean diffusivity, the shape (oblong) to the degree of fractional anisotropy and the orientation to the fiber main direction. B left to right: After the ellipsoids have been obtained for all voxels of the image (here for the cortico-spinal tract out of the motor cortex in red) an algorithm is used to determine whether adjacent voxels are likely to be connected (here with the FACT algorithm from Mori et al., 1999). Connected voxels within putative tracts are then displayed using pseudo-colors. It should be noticed that such color tracks are purely the results of a software and do not represent genuine anatomical structures.
Fig. 3
Fig. 3
Elementary mechanisms of hindered diffusion. For free diffusion, the diffusion distance increases linearly with the square root of the diffusion distance with the diffusion coefficient as a constant slope. In the presence of obstacles, such as cell membranes, diffusion is not free and the diffusion distance increases less with the diffusion time. For diffusion restricted in a space of dimension d, the diffusion distance plateaus at d. For tortuous diffusion or diffusion through permeable barriers, the diffusion distance first increases as for free diffusion for very short diffusion times (usually not reachable with MRI) and stabilizes at a slower rate for long diffusion times. This reduced diffusion coefficient depends on the geometry of the tissue (tortuosity factor) and the membrane permeability constant. Bulk diffusion may also be reduced compared to free water because of the molecular crowding (proteins, macromolecules) within the cellular environment.
Fig. 4
Fig. 4
Left: dMRI image obtained at early admission of a patient with middle cerebral artery trunk occlusion. The initial infarct lesion is outlined in red. Middle: On ADC map obtained at admission, the lesion is shaded red, while the predicted outcome volume from a growing model is outlined in yellow. Right: On follow-up dMRI image, the final measured infarct volume, outlined in red, is visible as a hyperintense region, even larger than expected from model. The development of such models will be very useful to predict outcome and orient initial treatment, depending on the expected volume and more importantly the territory which will be affected. Images taken from Rosso et al. Radiology (2009), with permission.
Fig. 5
Fig. 5
Tractography allows for ‘virtual dissection’ of major fiber bundles from the human brain. Illustrated here, from left to right, are the corpus callosum, inferior frontal occipital fasciculus, and superior longitudinal fasciculus. Images taken from Catani et al. Neuroimage (2002), with permission.
Fig. 6
Fig. 6
Tractography algorithms that can model more than one fiber population allow for tracking through regions of fiber crossing. One the left hand side of this image are results for tracking the corticospinal tract in 9 individual brains using a single fiber probabilistic model; typically, only the medial portions of the tract can be followed. On the right hand side the same data is modeled using two fiber orientations and the more lateral portions of the tract can now be seen. Images taken from Behrens et al. Neuroimage (2007), with permission.
Fig. 7
Fig. 7
Validation of tractography is an important challenge. Here, results from autoradiographic tracing of fibers in postmortem monkey brains (top row) are compared to results using diffusion spectrum tractography (bottom row) obtained postmortem in different monkeys. Qualitatively, good agreement is found between the course of the third portion of the superior longitudinal fasciculus (left), fronto-occipital fasciulus (middle), and arcuate fasciculus (right). Images taken from Schmahmann et al. Brain (2007) with permission.
Fig. 8
Fig. 8
Considering multiple diffusion parameters, as well as findings based on tractography, can shed light on complex pathology. In this example, diffusion images were acquired in patients with Alzheimer’s Disease, Mild Cognitive Impairment, and Healthy Controls. In addition to calculating fractional anisotropy (FA), the authors also calculated the mode of anisotropy, which quantifies the degree to which the tensor is planar (disc-shaped) or linear (cigar-shaped), as shown in the schematic in the top right (taken from Ennis and Kindlmann, MRM, 2006). Mode was more sensitive than FA to differences between MCI and controls. The top left figure illustrates that patients showed a counter-intuitive increase in mode (shown in pink), along with an increase in fractional anisotropy (shown in yellow), specifically in a region where association fibers cross with projection fibers. Closer interrogation of this crossing fiber region using tractography (bottom panel), revealed that patients had a decrease in tractography particles in the association fibers (AF), with no change in particles in the projection fibers (PF). Images taken from Douaud et al. Neuroimage (2011), with permission.

References

    1. Amunts K, Schleicher A, Burgel U, Mohlberg H, Uylings HB, Zilles K. Broca’s region revisited: cytoarchitecture and intersubject variability. J. Comp. Neurol. 1999;412:319. - PubMed
    1. Anderson AW, Gore JC. Analysis and correction of motion arifacts in diffusion weighted imaging. Magn. Reson. Med. 1994;32:379–387. - PubMed
    1. Andrew RD, Macvicar BA. Imaging cell volume changes and neuronal excitation in the hippocampal slice. Neuroscience. 1994;62:371–383. - PubMed
    1. Anwander A, Tittgemeyer M, Von Cramon DY, Friederici AD, Knosche TR. Connectivity-based parcellation of Broca’s area. Cereb. Cortex. 2007;17:816–825. - PubMed
    1. Aso T, Urayama S, Poupon C, Sawamoto N, Fukuyama H, Le Bihan D. An intrinsic diffusion response function for analyzing diffusion functional MRI time series. Neuroimage. 2009;47:1487–1495. - PubMed

Publication types

MeSH terms