. 2011 Nov 27;17(12):1657-62.
doi: 10.1038/nm.2576.

Using iPSC-derived neurons to uncover cellular phenotypes associated with Timothy syndrome

Affiliations

Using iPSC-derived neurons to uncover cellular phenotypes associated with Timothy syndrome

Sergiu P Paşca et al. Nat Med. .

Abstract

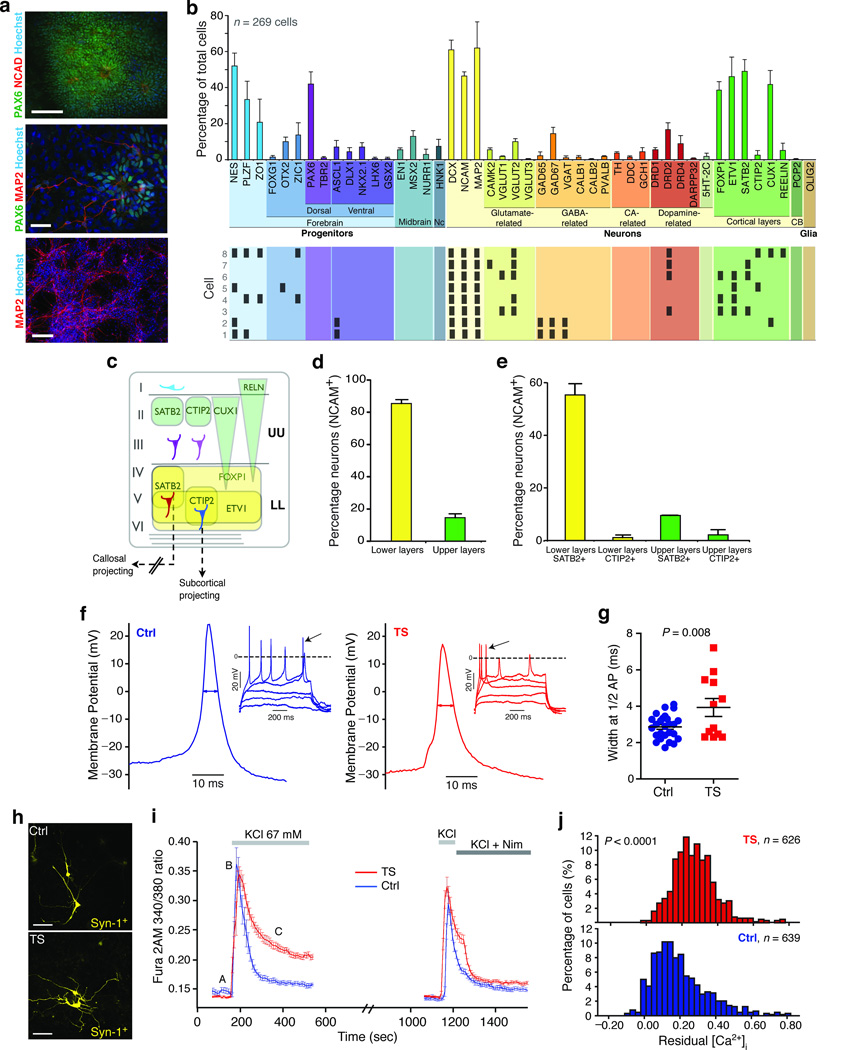
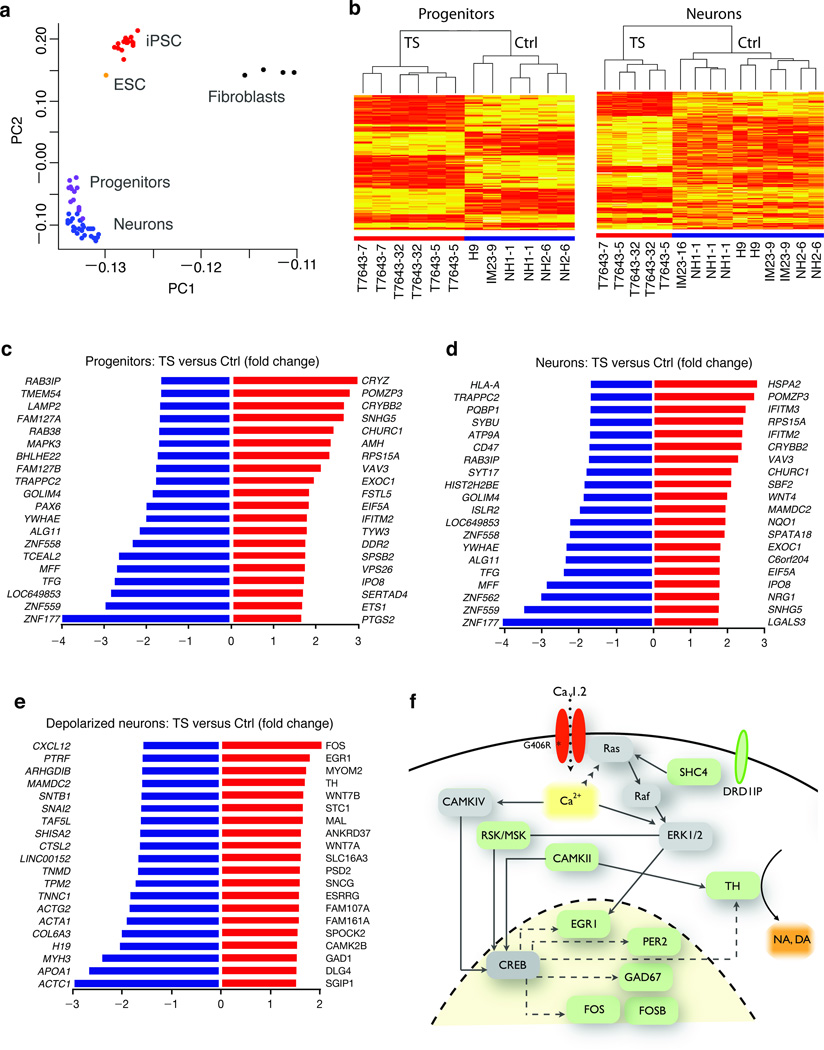
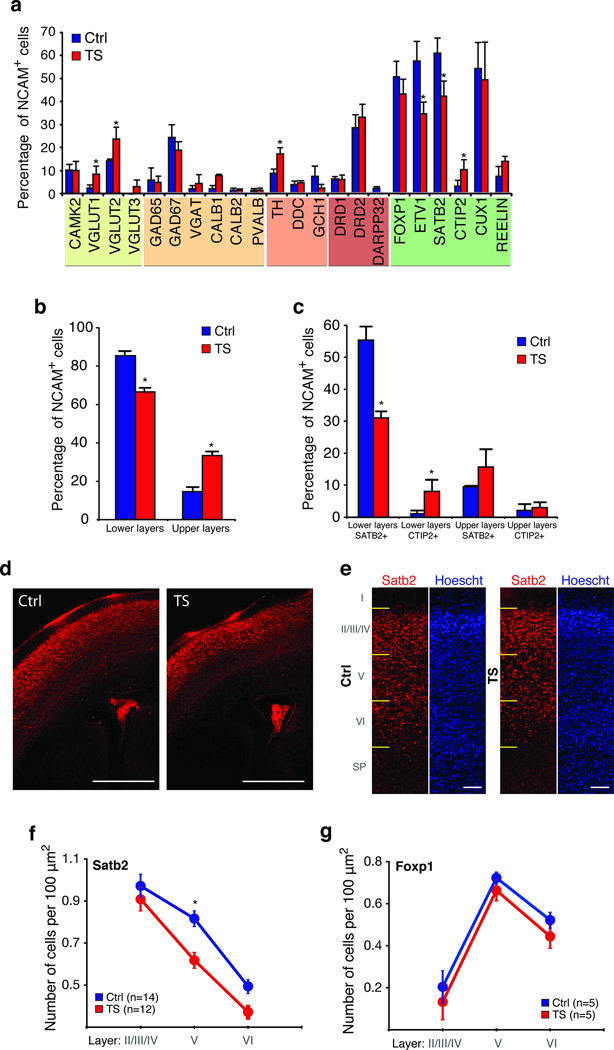
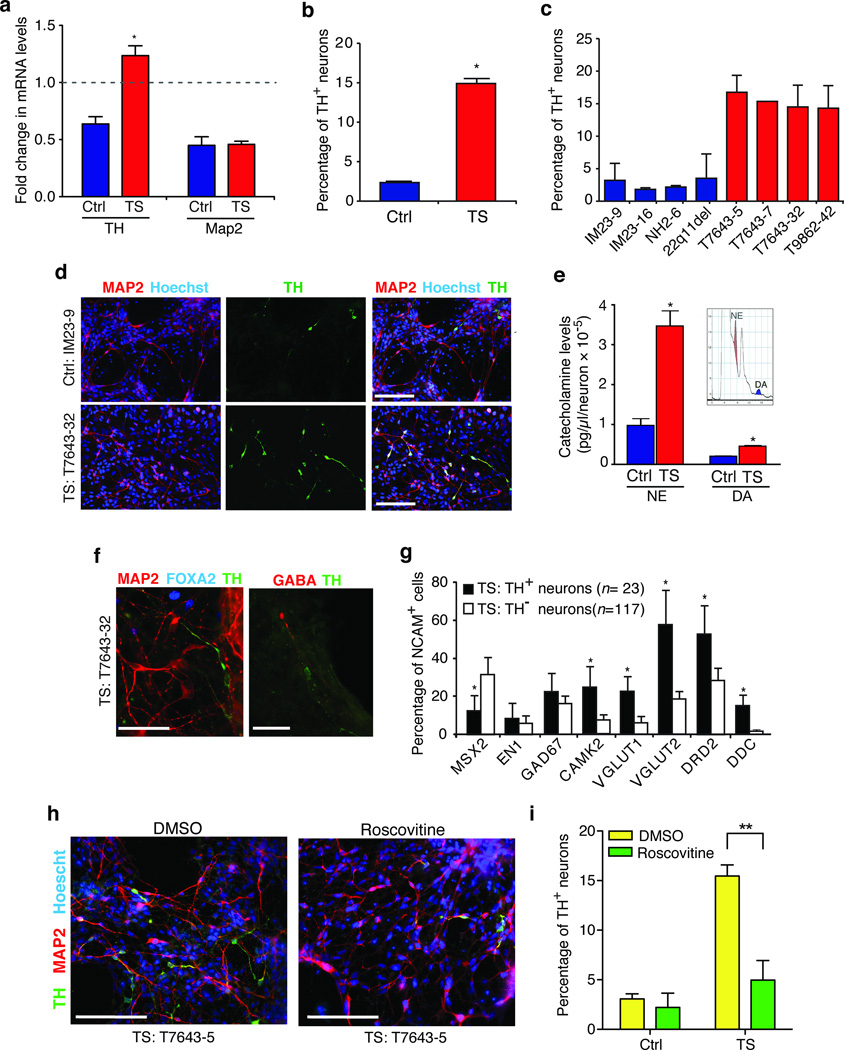
Monogenic neurodevelopmental disorders provide key insights into the pathogenesis of disease and help us understand how specific genes control the development of the human brain. Timothy syndrome is caused by a missense mutation in the L-type calcium channel Ca(v)1.2 that is associated with developmental delay and autism. We generated cortical neuronal precursor cells and neurons from induced pluripotent stem cells derived from individuals with Timothy syndrome. Cells from these individuals have defects in calcium (Ca(2+)) signaling and activity-dependent gene expression. They also show abnormalities in differentiation, including decreased expression of genes that are expressed in lower cortical layers and in callosal projection neurons. In addition, neurons derived from individuals with Timothy syndrome show abnormal expression of tyrosine hydroxylase and increased production of norepinephrine and dopamine. This phenotype can be reversed by treatment with roscovitine, a cyclin-dependent kinase inhibitor and atypical L-type-channel blocker. These findings provide strong evidence that Ca(v)1.2 regulates the differentiation of cortical neurons in humans and offer new insights into the causes of autism in individuals with Timothy syndrome.


Figures

Figure 1
Figure 1. Characterization of iPSC-derived NPCs and neurons
(a) Immunostaining of neural rosettes (upper: PAX6, N-Cadherin, Hoescht; scale bar is 100 µm), neurons (MAP2) and progenitors (PAX6) after plating of the neurospheres (middle, scale bar 100 µm) and cultures at day 43 of differentiation (lower: MAP2, Hoescht; scale bar is 200 µm). The middle image is from a Timothy syndrome–derived culture, and the other two are from cultures derived from control individuals. (b) Single cell gene expression analysis (Fluidigm) of the population of cells at 45 days of differentiation. Shown are the proportion of cells that express a cell-specific marker (mean ± s.e.m.; n = 269 cells from three control iPSC lines). The lower panel shows gene expression profiles of single neurons. (c) Scheme illustrating marker gene expression in upper and lower layers of the human cortex. (d) Fraction of neurons (NCAM+) expressing lower (FOXP1+/ETV1+) or upper layer (FOXP1–/ETV1–) cortical markers as assessed by Fluidigm (mean ± s.e.m; n = 116 cells from three controls iPSC lines). (e) Fraction of subpopulations of upper and lower layer neurons (NCAM+) expressing CTIP2 or SATB2. (f) Representative current clamp recordings (holding potential −65 mV; 1s current pulses, ΔIinj = 5–10 pA) from TS and control derived neurons. (g) APs recorded from TS neurons were significantly wider. (h) Representative images of control and TS neurons expressing YFP under the control of the Synapsin-1 promoter (scale bars are 50 µm). (i) Average [Ca2+]i measurements in Synapsin-1 expressing neurons depolarized twice with 67 mM KCl and treated with 5 µM nimodipine (TS; n = 10 neurons; Ctrl; n = 9 neurons). (j) Histogram of residual [Ca2+]i ([C–A]/[B–A]) in neurons (three TS lines, three control lines, t-test, P < 0.0001; see also Supplementary Fig. 8c).
Figure 2
Figure 2. Characterization of NPCs and neurons derived from TS individuals and controls by genome-wide microarrays
(a) Principal component analysis of whole-genome gene expression profiles for fibroblasts, iPSC, embryonic stem cells (ESC), NPCs and neurons showing clustering of cell types based on the first two principal components (PC1 and PC2). (b) Heatmaps depicting expression levels of genes differentially expressed between TS and control NPCs and neurons. Each column represents an independent differentiation of an iPSC line. Genes that are highly expressed in TS cells relative to controls are shown in red. Dendrograms show hierarchical clustering of samples based on differentially expressed genes. (c) and (d) List of top 20 genes showing the highest expression differences between TS and control cells (c, progenitors; d, neurons). (e) Differentially expressed genes in TS neurons relative to control neurons after electrical stimulation. (f) Scheme illustrating interactions between a subset of calcium regulated genes upregulated in TS (shown in green).
Figure 3
Figure 3. Characterization of neuronal subpopulations differentiated from TS and control iPSCs
(a) Single cell qPCR analysis (Fluidigm) showing the proportion (mean ± s.e.m., *P < 0.05, Chi-square test) of NCAM+ neurons expressing subtype-specific markers, for control (n = 125 cells, three lines) and TS cultures (n = 140 cells, three lines). (b) Fraction of neurons expressing upper and lower cortical layer makers in TS (n = 125 cells) and control cortical cultures (n = 116 cells; mean ± s.e.m. *P < 0.05, Chi-square test). (c) Fraction of neurons expressing SATB2 and CTIP2 and either lower or upper layer cortical markers in TS and control cultures (mean ± s.e.m. *P < 0.05, Chi-square test). (d) 50× image of Satb2 stained cortical sections from a control mouse and a mouse expressing the TS channel in the forebrain showing a decrease in Satb2+ cells. Scale bar is 500 µm. (e) Image of Satb2 stained cortical sections from control and TS mouse at P0.5 (scale bar is 50 µm). (f) Measurement of the number of Satb2+ cortical neurons in cortical sections from TS and control mice (mean ± s.e.m.; TS: n = 12 animals, Ctrl: n = 14 animals; two-way ANOVA, P = 0.001; asterisk denotes P < 0.05 for posthoc analysis) (g) Distribution of Foxp1+ neurons in cortical sections from TS and control mice (mean ± s.e.m.; n = 5 animals per group; two-way ANOVA, P > 0.05).
Figure 4
Figure 4. Abnormal expression of TH in neurons from TS individuals
(a) Fold changes in TH and MAP2 mRNA levels in TS and control neurons after nine hours of depolarization with 67 mM KCl. (b) TS neuronal cultures contain an excess number of TH+ neurons (*P < 0.001, t-test). (c) The proportion of TH+ neurons (TH+/MAP2+) is shown for three control lines from two healthy individuals (IM23-9, IM23-16, NH2-6), one line derived from a individual with 22q11.2 deletion syndrome, and four TS lines from two individuals (T7643-5, T7643-7, T7643-32, T9862-42). (d) Representative images of neurons stained with TH and MAP2 specific antibodies and Hoechst 33258 (scale bars are 200 µm). (e) Norepinephrine (NE, *P = 0.004) and dopamine (DA, *P = 0.001) levels are elevated in media collected from TS neuronal cultures relative to controls. Inset shows an HPLC chromatogram with the peaks for NE and DA. (f) TH+ neurons (green) in TS cultures (T7643-32 line is shown) are not immunostained by antibodies to FOXA2 (left, blue) or GABA (right, red). Scale bar is 50 µm. (g) Fraction of TH+ or TH neurons from TS individuals that co-express other neuronal marker genes (mean ± s.e.m.,* P < 0.05, Chi-square test). (h) Cultures of TS neurons treated with roscovitine (15 µM at day 39 and 10 µM at day 41) or DMSO and stained with TH and MAP2 specific antibodies at day 43 of differentiation. Scale bar is 200 µm. (i) Proportion of TH+ neurons (TH+/MAP2+) in control and TS cultures after treatment with roscovitine or DMSO (mean ± s.e.m., two-way ANOVA, **P < 0.001).

Comment in

References

    1. Splawski I, et al. Ca(V)1.2 calcium channel dysfunction causes a multisystem disorder including arrhythmia and autism. Cell. 2004;119:19–31. - PubMed
    1. Yarotskyy V, et al. Roscovitine binds to novel L-channel (CaV1.2) sites that separately affect activation and inactivation. J Biol Chem. 2010;285:43–53. - PMC - PubMed
    1. Yarotskyy V, Elmslie KS. Roscovitine, a cyclin-dependent kinase inhibitor, affects several gating mechanisms to inhibit cardiac L-type (Ca(V)1.2) calcium channels. Br J Pharmacol. 2007;152:386–395. - PMC - PubMed
    1. Wang X, et al. Phospholemman modulates the gating of cardiac L-type calcium channels. Biophys J. 2010;98:1149–1159. - PMC - PubMed
    1. Wang K, et al. Common genetic variants on 5p14.1 associate with autism spectrum disorders. Nature. 2009;459:528–533. - PMC - PubMed

Publication types

MeSH terms

Supplementary concepts

Associated data