

doi: 10.1038/nmeth.1781.
Decoding cell lineage from acquired mutations using arbitrary deep sequencing
Affiliations
- PMID: 22120468
- PMCID: PMC3248619
- DOI: 10.1038/nmeth.1781
Item in Clipboard
Decoding cell lineage from acquired mutations using arbitrary deep sequencing
Nat Methods.
.
Abstract
Because mutations are inevitable, the genome of each cell in a multicellular organism becomes unique and therefore encodes a record of its ancestry. Here we coupled arbitrary single primer PCR with next-generation DNA sequencing to catalog mutations and deconvolve the phylogeny of cultured mouse cells. This study helps pave the way toward construction of retrospective cell-fate maps based on mutations accumulating in genomes of somatic cells.
Conflict of interest statement
Figures
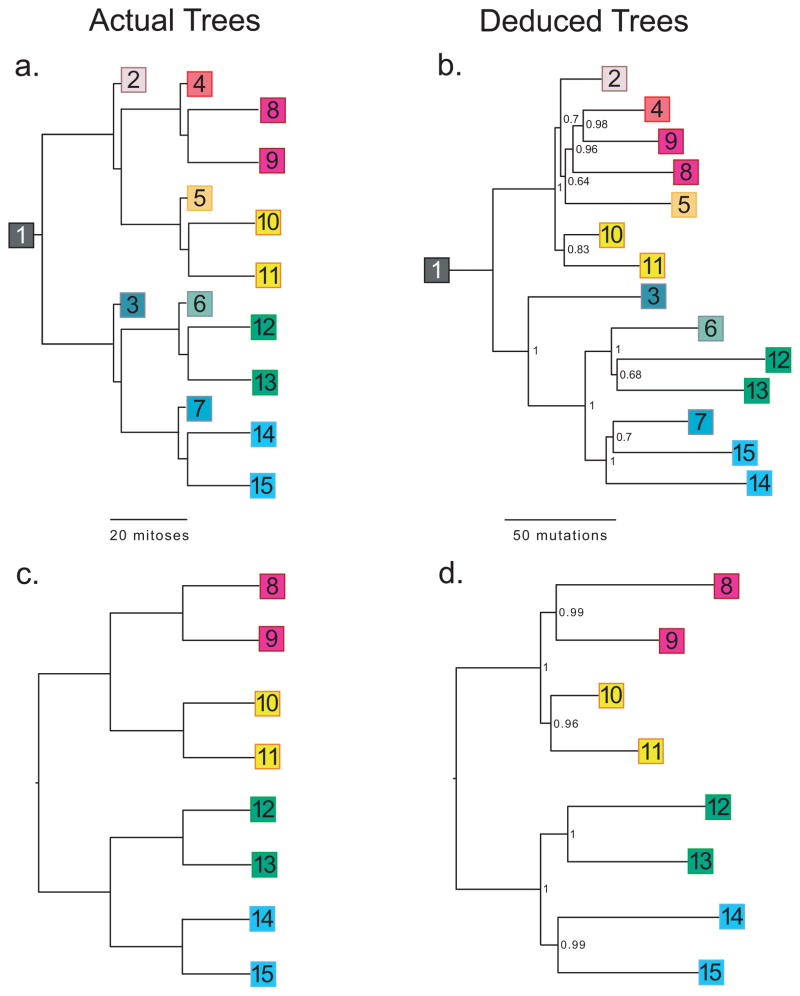
Cell lineages. (a) A single mouse fibroblast was seeded onto a Petri dish. After approximately 20 doublings, a single cell was used to seed each of the next tier of dishes, and so on. (b) Lineage reconstructed from 592 mutations identified from sequencing of single primer arbitrary PCR products from DNA extracted from all 15 dishes. (c) Simplified lineage tree, similar to Fig. 1a, but showing only the terminal nodes. (d) Lineage reconstructed from the 667 mutations present in only the terminal nodes. Numbers in deduced trees are Bayesian posterior probabilities.
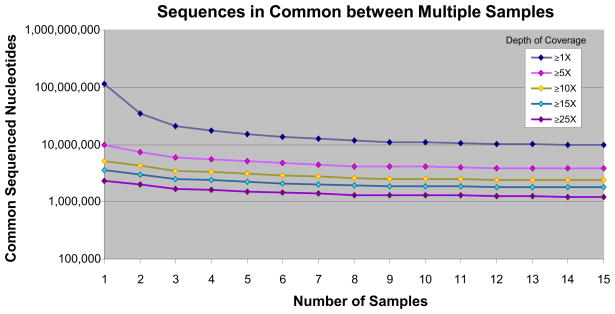
Sample-to-sample reproducibility. Total quantity of unique genomic sequence shared among all samples, at various minimum depths of coverage, as number of samples increases from 1 to 15 (for example, at ≥1× depth of coverage, there are ~10,000,000 unique genomic positions that are sequenced in common to all 15 samples).

Genome browser snapshot. Shown are histogram plots of an ~3 Kb amplicon on chromosome 1 corresponding to mapped reads from arbitrary PCR for the first 6 samples (bottom six graphs). Other tracks include (from top to bottom): known genes (coverage overlaps with exons and introns of Il19), position of identified mutations (vertical red line at right end of plots) that are found in at least one sample, minimum fold-coverage common to all 15 samples, and mean fold-coverage for all 15 samples. Note that PCR is highly consistent from one sample to the next. Also note low depth-of-coverage reads unique to each sample (flanking the amplicon).
References
-
- Frumkin D, et al. Cell lineage analysis of a mouse tumor. Cancer Res. 2008;68:5924–5931. - PubMed
Publication types
MeSH terms
Grants and funding
- T32 HL007093/HL/NHLBI NIH HHS/United States
- R01DK078340/DK/NIDDK NIH HHS/United States
- DP1OD003278/OD/NIH HHS/United States
- T32HL007093/HL/NHLBI NIH HHS/United States
- R01 CA111582/CA/NCI NIH HHS/United States
- R01 DK078340/DK/NIDDK NIH HHS/United States
- R01CA111582/CA/NCI NIH HHS/United States
- T32 GM007266/GM/NIGMS NIH HHS/United States
- F30 AG030316/AG/NIA NIH HHS/United States
- F30AG030316/AG/NIA NIH HHS/United States
- R01 CA098243/CA/NCI NIH HHS/United States
- R01CA0982/CA/NCI NIH HHS/United States
- DP1 OD003278/OD/NIH HHS/United States
- T32GM007266/GM/NIGMS NIH HHS/United States
LinkOut - more resources
Full Text Sources
Other Literature Sources
