. 2012 Jun 1;520(8):1819-30.
doi: 10.1002/cne.23015.

Second-order input to the medial amygdala from olfactory sensory neurons expressing the transduction channel TRPM5

Affiliations

Second-order input to the medial amygdala from olfactory sensory neurons expressing the transduction channel TRPM5

John A Thompson et al. J Comp Neurol. .

Abstract

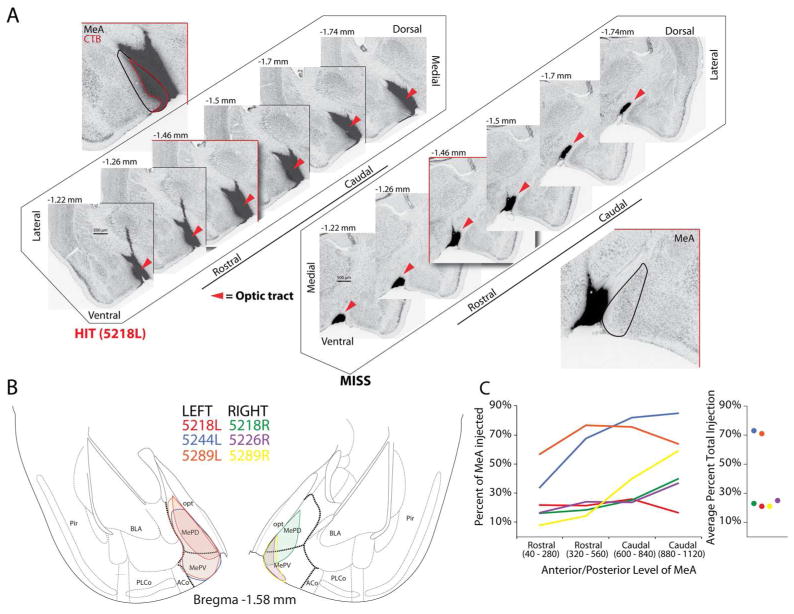
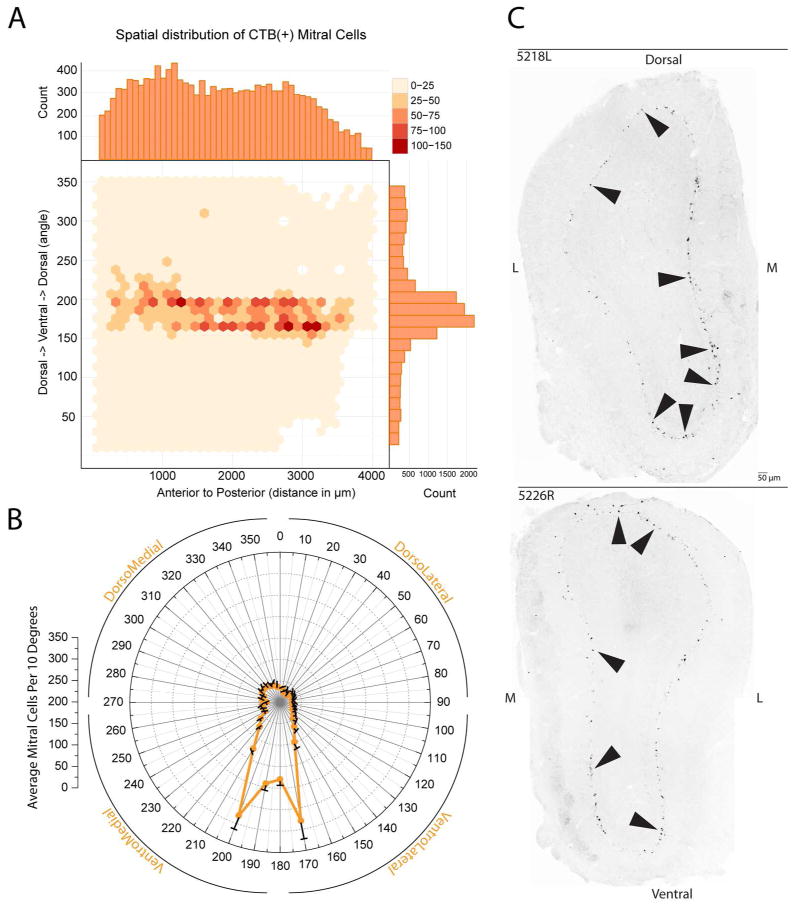
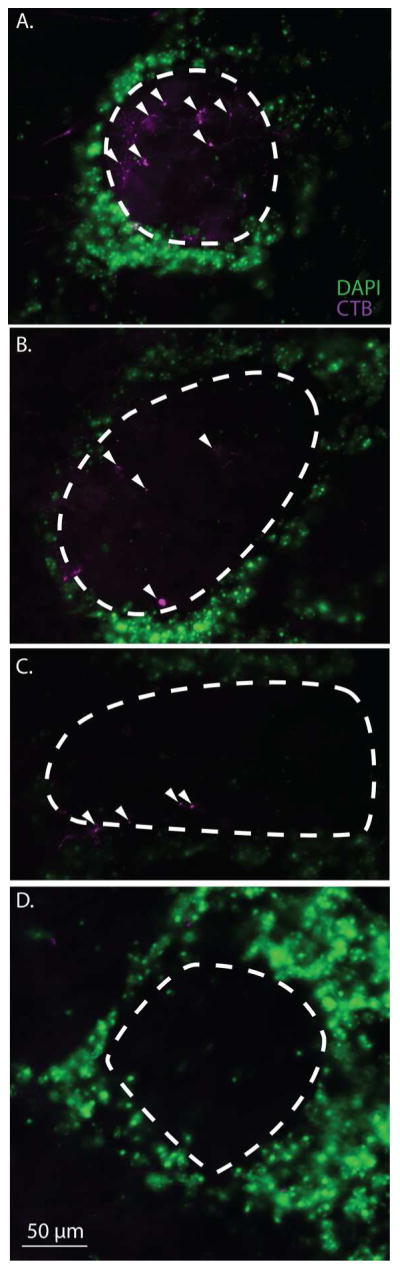
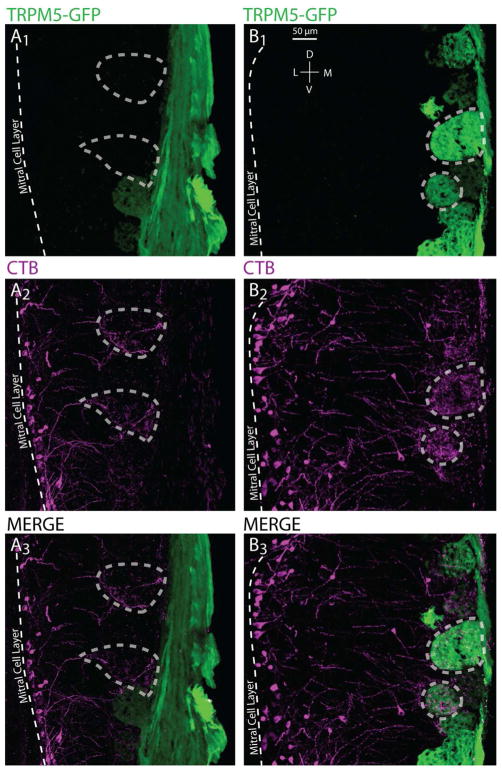
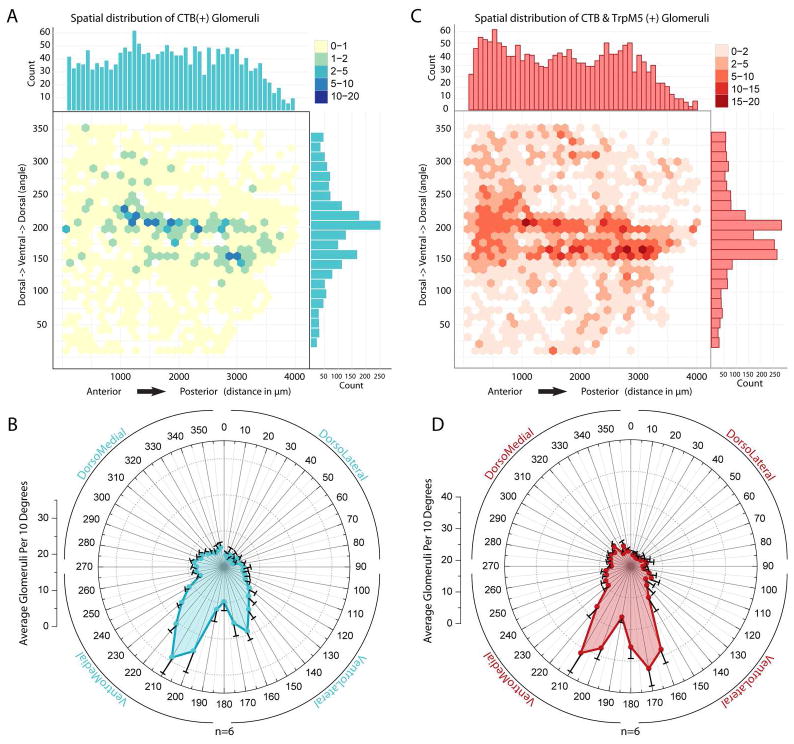
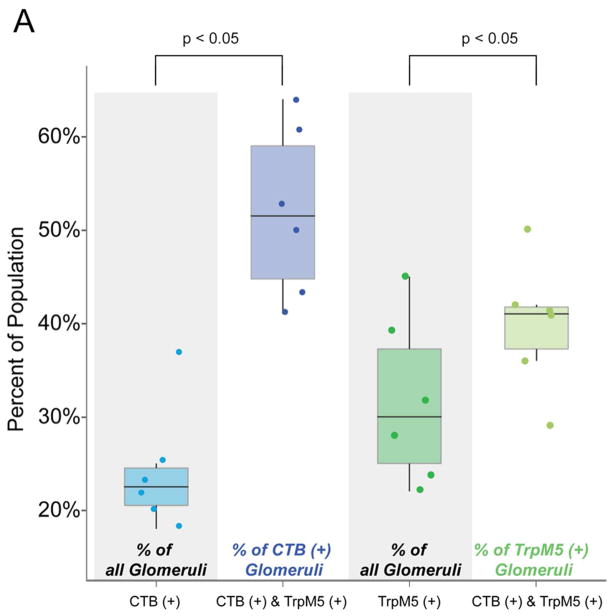
Recent anatomical tracing experiments in rodents have established that a subset of mitral cells in the main olfactory bulb (MOB) projects directly to the medial amygdala (MeA), traditionally considered a target of the accessory olfactory bulb. Neurons that project from the MOB to the MeA also show activation in response to conspecific (opposite sex) volatile urine exposure, establishing a direct role of the MOB in semiochemical processing. In addition, olfactory sensory neurons (OSNs) that express the transient receptor potential M5 (TRPM5) channel innervate a subset of glomeruli that respond to putative semiochemical stimuli. In this study, we examined whether the subset of glomeruli targeted by TRPM5-expressing OSNs is innervated by the population of mitral cells that projects to the MeA. We injected the retrograde tracer cholera toxin B (CTB) into the MeA of mice in which the TRPM5 promoter drives green fluorescent protein (GFP). We found overlapping clusters of CTB-labeled mitral cell dendritic branches (CTB(+) ) in TRPM5-GFP(+) glomeruli at significantly greater frequency than expected by chance. Despite the significant degree of colocalization, some amygdalopetal mitral cells extended dendrites to non-TRPM5-GFP glomeruli and vice versa, suggesting that, although significant overlapping glomerular innervation is observed between these two features, it is not absolute.


Figures

Figure 1
Figure 1
Cholera toxin subunit B (CTB) injections into medial amygdala (MeA). A. Left series of images show representative injection into the MeA (HIT), and right series of images show representative missed injection aimed at MeA (MISS, dark label reflects CTB-conjugated Alexa 555); cytoarchitecture labeled with fluorescent Nissl (488) and fluorescent labels have been inverted and gray-scaled. Red outlined box is an enlarged representative image of injection. B. Overlay of region of largest cross-sectional extent of CTB label in each case in which MeA was successfully targeted (colors indicate individual successful injections). C. Average total volume of MeA encompassed by CTB injection and rostrocaudal distribution of CTB spread across MeA for each case. Abbreviations: Pir Piriform cortex, BLA Basal lateral amygdala, PLCo Posterolateral cortical amygdaloid area, ACo Anterior cortical amygdaloid area, MePV Medial amygdala posteroventral part, MePD Medial amygdala posterodorsal part, opt optic tract.
Figure 2
Figure 2
Mapping of retrogradely labeled CTB(+) mitral cells in the main olfactory bulb following CTB injections in the medial amygdala. A. Mapping of the spatial distribution and density of CTB(+) mitral cells for the dorsoventral and rostrocaudal axes across all cases as plotted onto an unfolded map of the mitral cell layer of the olfactory bulb. The anterior-posterior axis is represented left to right (respectively) while the radial angle around the bulb is plotted on the y-axis; axis with ventral indicated by 180°. The density of labeled mitral cells (in # of cells per 30 by 30 bin) is given by the intensity of the color. B. Distribution of CTB(+) mitral cells across the dorsoventral axis for all cases with mean and SEM. C. Negative images of fluorescent (CTB-conjugated Alexa 555) micrographs of transverse sections through the olfactory bulb in two cases with successful injections into MeA. Black arrows indicate retrogradely labeled mitral cells.
Figure 3
Figure 3
Morphological features of CTB labeled mitral cell terminations within the glomerular layer. A, B, C show the high morphological variation in mitral cell processes labeled with CTB within the glomerular boundary following MeA injection. White arrows indicate positive CTB labeled mitral cell terminations and the white dotted line demarcates the glomerular boundary. D. A representative glomerulus that lacks CTB labeling.
Figure 4
Figure 4
Confocal images of CTB(+), TRPM5(+) and CTB(+) & TRPM5(+) glomeruli in the MOB. Sections are oriented in the coronal plane. A and B represent example regions of the MOB from two different successfully injected cases with TRPM5-GFP(+) glomeruli in green and CTB(+) mitral cells terminating in the glomerular layer in magenta. A1–3 show an example in which the TRPM5-GFP(+) expression and CTB(+) label do not overlap; dashed polygons encircle glomeruli that are labeled with CTB(+) only. B1–3 highlight examples of TRPM5-GFP(+) expression and CTB(+) label overlap in the glomerular layer; dashed polygons encircle glomeruli that express CTB(+) & TRPM5-GFP(+).
Figure 5
Figure 5
CTB(+) and CTB(+) & TRPM5(+) glomeruli primarily observed in the ventral medial portion of the main olfactory. A. Spatial distribution and density of CTB(+) glomeruli for the dorsoventral and rostrocaudal axes across all cases. B. Distribution of CTB(+) glomeruli across the dorsoventral axis of the bulb for all cases with mean and SEM. C. Spatial distribution and density of CTB(+) & TRPM5(+) glomeruli for the dorsoventral and rostrocaudal axes across all cases. D. Distribution of CTB(+) & TRPM5(+) glomeruli across the dorsoventral axis for all cases with mean and SEM.
Figure 6
Figure 6
Comparison of proportions of glomeruli showing CTB(+), TRPM5-GFP(+) and CTB(+) & TRPM5-GFP(+) colocalization. The four boxplots show the percent of the glomerular populations in six hemispheres. For each boxplot we show the median (the line in the middle of each box), the interquartile range (IQR; top and bottom of the box) and the whiskers (lines extending above and below each box indicate highest and lowest datum that falls within 1.5 x IQR). In addition, points show the percent of the population for each hemisphere. The percent of CTB(+) & TRPM5-GFP(+) colocalization within the CTB(+) and TRPM5-GFP(+) populations was significantly greater than the proportion of CTB(+) and TRPM5-GFP(+) glomeruli (p < 0.05 for both comparisons) in the total population indicating that the colocalization was likely greater than chance overlap.

References

    1. Cetin A, Komai S, Eliava M, Seeburg PH, Osten P. Stereotaxic gene delivery in the rodent brain. Nat Protoc. 2006;6:3166–73. - PubMed
    1. Clapp TR, Medler KF, Damak S, Margolskee RF, Kinnamon SC. Mouse taste cells with G protein-coupled taste receptors lack voltage-gated calcium channels and SNAP-25. BMC Biol. 2006;4:7. - PMC - PubMed
    1. Doucette W, Milder J, Restrepo D. Adrenergic modulation of olfactory bulb circuity affects odor discrimination. Learn Mem. 2007;14:539–47. - PMC - PubMed
    1. Doucette W, Gire DH, Whitesell J, Carmean V, Lucero MT, Restrepo D. Associative cortex features in the first olfactory brain relay station. Neuron. 2011;69:1176–87. - PMC - PubMed
    1. Dulac C, Torello AT. Molecular detection of pheromone signals in mammals: from genes to behavior. Nat Rev Neurosci. 2003;7:551–62. - PubMed

Publication types