

Review
doi: 10.1007/s00247-011-2298-6.
Epub 2011 Nov 27.
Pediatric MR elastography of hepatic fibrosis: principles, technique and early clinical experience
Affiliations
- PMID: 22120578
- PMCID: PMC3352031
- DOI: 10.1007/s00247-011-2298-6
Item in Clipboard
Review
Pediatric MR elastography of hepatic fibrosis: principles, technique and early clinical experience
Pediatr Radiol.
2012 Apr.
Abstract
Numerous pediatric conditions result in hepatic fibrosis. As treatments develop for the underlying disorders, a non-invasive assessment of liver fibrosis would be beneficial as an adjunct or possible replacement for the traditional gold standard, liver biopsy. Magnetic resonance elastography is a noninvasive imaging technique that has been used successfully in adults for identification and assessment of liver fibrosis. This review describes the basic principles of MR elastography as well as the technical aspects specific to children. Clinical pediatric applications, limitations and areas for future research are described.
Figures
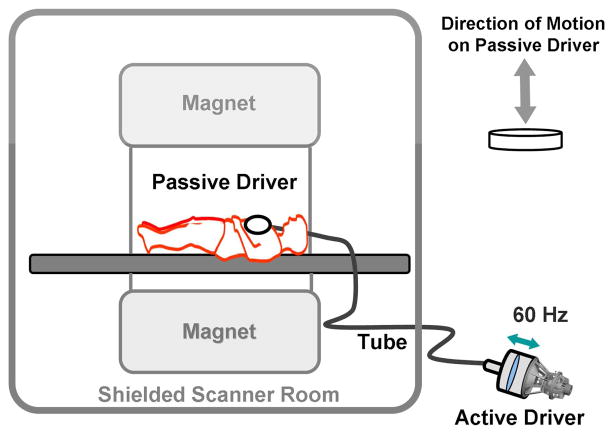
Schematic drawing of an acoustic speaker source with connecting tubing and a driver for MRE. The active driver is shielded from the imaging magnet and delivers vibrational energy to the passive driver at 60Hz through the connecting tube. The passive driver is placed across the right anterior chest wall to deliver vibrations transcostally into the liver.
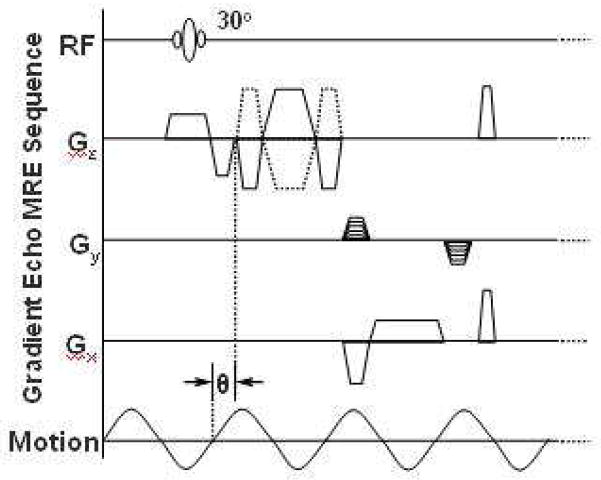
MRE pulse sequence diagram illustrating the timing of the imaging and motion-encoding gradients in relation to the applied vibration. Theta indicates an adjustable phase delay between the motion and the motion-encoding gradients to capture the tissue motion at different time points during the wave propagation.
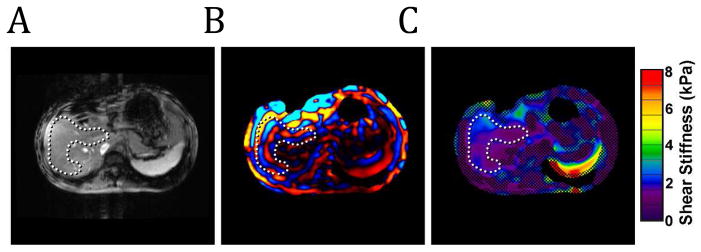
A) MR magnitude image. The C-shaped ROI (dotted line) within the hepatic parenchyma is defined to avoid the central portal vessels. B) Wave image showing the propagation of the shear waves through the hepatic parenchyma. The wave pattern within the liver can be visualized by the alternating colored bands. C) Color-coded elastogram. Post-processing of the MRE wave data identified poor wave propagation in the hatched areas. These areas are not included in the elasticity assessment. The ROI shows blue and purple areas corresponding to normal elasticity values <2.9kPa.
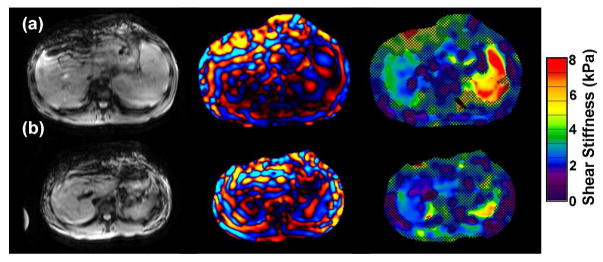
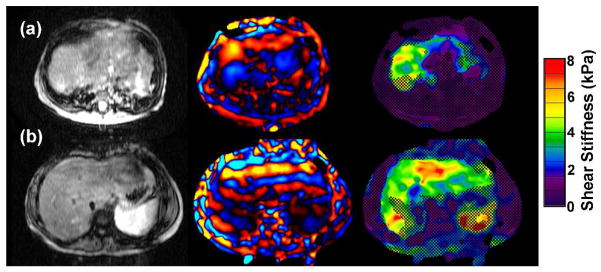
MRE of 2 patients with inflammatory bowel disease. A) 16 year old with chronic ulcerative colitis and PSC. MRE demonstrates mildly increased liver elasticity: mean = 3.2 kPa, range = 3.0–3.4 kPa, consistent with mild hepatic fibrosis. Liver biopsy on the same day demonstrated low-grade bridging fibrosis (grade 1–2 of 4). B) 14 year old with Crohns colitis and PSC. MRE is normal (mean = 2.3 kPa). Biopsy from the same day showed no hepatic fibrosis.
MRE of two patients with congenital fibrogenic liver disease and marked liver fibrosis on biopsy (grade 3 of 4). Yellow, green and red areas indicate elevated liver stiffness. A) 10 month old with familial cholestasis type 3. MRE demonstrates markedly elevated liver stiffness, (mean = 3.9 kPa, range = 3.2–6.1 kPa). B) 10 year old with alpha-1 anti-trypsin deficiency. MRE demonstrates elevated liver stiffness (mean = 4.1 kPa, range = 3.9–4.3 kPa).
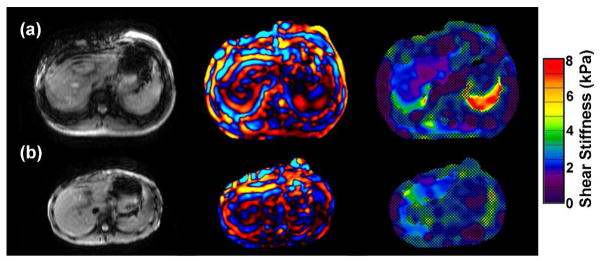
A) 16 year old with chronic hepatitis B. Elastogram was normal (mean = 2.4 kPa) though biopsy showed minimal fibrosis (grade 1–2 of 4). B) 17 year old with autoimmune hepatitis. Pre-treatment liver biopsy showed marked hepatic fibrosis (grade 3 of 4). Following one month of treatment with the resolution of the clinical and laboratory findings of hepatitis, an MRE demonstrated normal elastogram (mean = 2.5 kPa, range = 2.3–2.9 kPa). Follow up liver biopsy was not performed after the MRE.
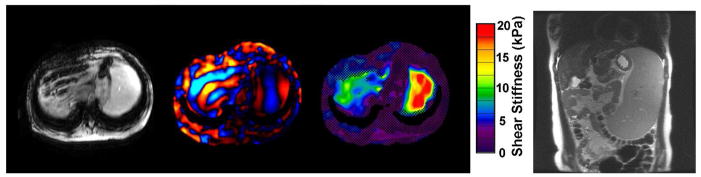
MRE in a 15 year old with EBV-related liver disease resulting in cirrhosis, marked portal hypertension with varices and severe splenomegaly. Elastogram demonstrates elevated mean liver stiffness of 5kPa. Note elevated splenic stiffness up to 20kPa, (red). Coronal MRI shows severe splenomegaly.
References
-
- Bonekamp S, Kamel I, Solga S, Clark J. Can imaging modalities diagnose and stage hepatic fibrosis and cirrhosis accurately? JHepatol. 2009 Jan;50(1):17–35. - PubMed
-
- Nobili V, Monti L, Alisi A, et al. Transient elastography for assessment of fibrosis in paediatric liver disease. Pediatr Radiol. 2011 Jun 16; [Epub ahead of print] - PubMed
Publication types
MeSH terms
Grants and funding
LinkOut - more resources
Full Text Sources
Medical
Research Materials
