. 2012 Aug 16;31(33):3785-95.
doi: 10.1038/onc.2011.536. Epub 2011 Nov 28.

Cyclin E1 is a common target of BMI1 and MYCN and a prognostic marker for neuroblastoma progression

Affiliations

Cyclin E1 is a common target of BMI1 and MYCN and a prognostic marker for neuroblastoma progression

L Mao et al. Oncogene. .

Abstract

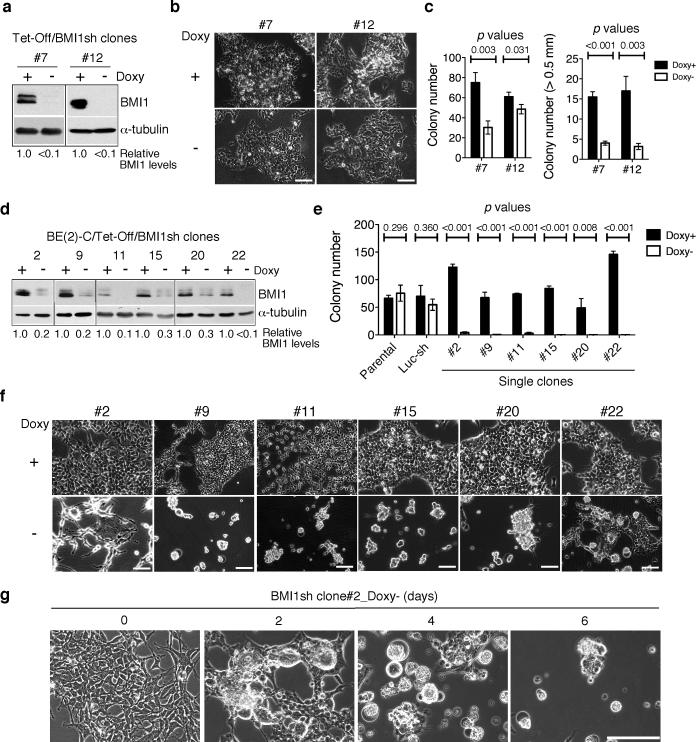
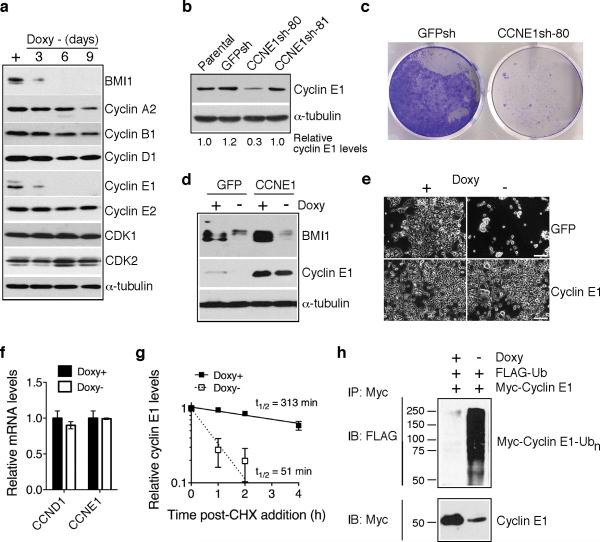
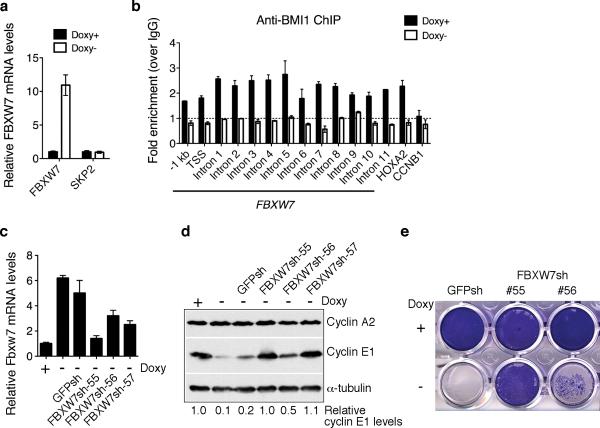
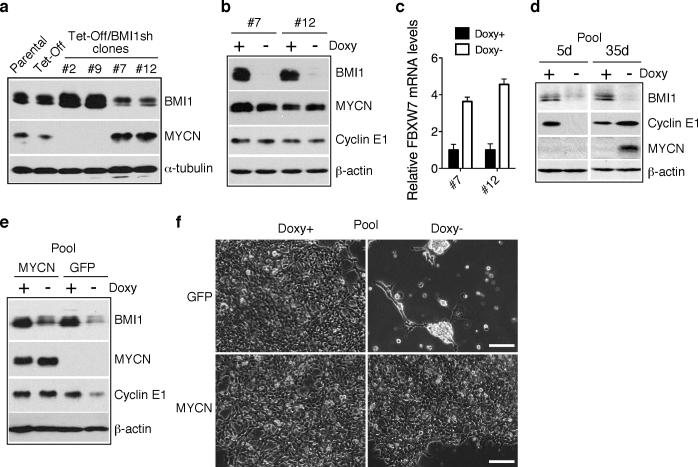
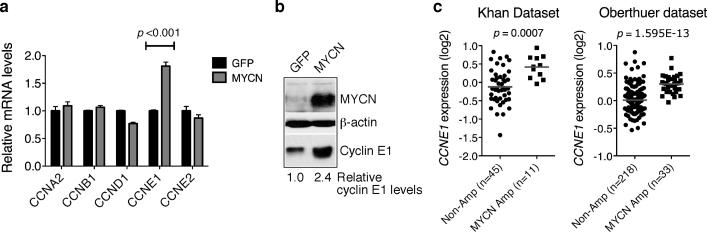
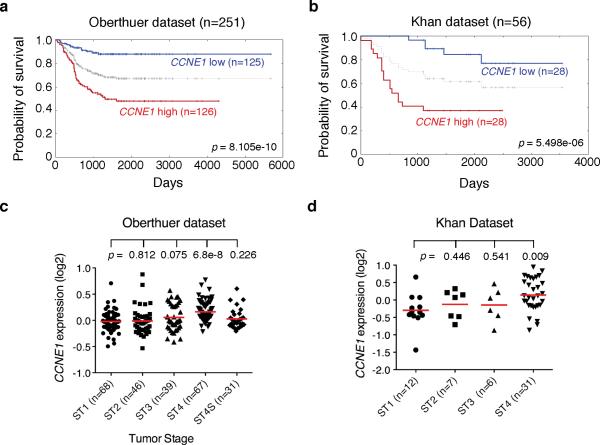
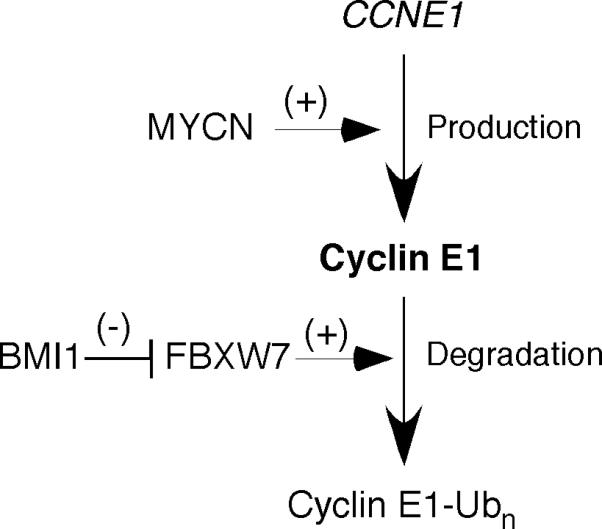
The Polycomb transcription repressor BMI1 is highly expressed in human neuroblastomas and is required for the clonogenic self-renewal and tumorigenicity of human neuroblastoma cell lines. The molecular basis of BMI1 action in neuroblastoma cells is not well understood. Here we report that BMI1 has a critical role in stabilizing cyclin E1 by repressing the expression of FBXW7, a substrate-recognition subunit of the SCF E3 ubiquitin ligase that targets cyclin E1 for degradation. BMI1 binds to the FBXW7 locus in vivo and represses its mRNA expression. Overexpression of cyclin E1 or abrogation of FBXW7 induction rescues the cell-death phenotype of BMI1 knockdown. Moreover, MYCN, an oncoprotein in the pathogenesis of high-risk neuroblastomas, is able to counteract the death-inducing effect of BMI1 knockdown by activating CCNE1 transcription. We further show that high cyclin E1 expression is associated with Stage 4 neuroblastomas and poor prognosis in patients. These findings suggest a molecular mechanism for the oncogenic activity of BMI1 and MYCN in neuroblastoma pathogenesis and progression by maintaining cyclin E1 levels.


Figures

Figure 1
Figure 1
Individual BE(2)-C neuroblastoma cells display differential sensitivities to BMI1 knockdown. a, Immunoblot analysis of BMI1 levels in clone-7 and -12 cells cultured in the presence or absence of doxycycline (Doxy) for 3 days. BMI1 levels were quantified against α-tubulin and are presented as the fraction of the BMI1 level in the presence of Doxy. b, Phase contrast imaging of clone-7 and -12 cells cultured in the presence or absence of Doxy for 10 days. Scale bars, 100 μm. c, Soft agar clonogenic assay of clone-7 and -12 cells in the presence or absence of Doxy. Numbers of total colonies and of the colonies that were larger than 0.5 mm were determined (error bars, s.d., n=3). d, Immunoblot analysis of BMI1 levels in BMI1-sensitive clones cultured in the presence or absence of Doxy for 3 days. BMI1 levels were quantified against α-tubulin and are presented as the fraction of the BMI1 level in the presence of Doxy. e, Soft agar clonogenic assay of parental and luciferase shRNA-expressing BE(2)-C cells, and BMI1-sensitive clones in the presence or absence of Doxy. Numbers of total colonies were determined (error bars, s.d., n=3). All quantitative data from soft agar assays were analyzed using two-tailed Student's t-test with the p values indicated. f, Phase contrast imaging of BMI1-sensitive clones cultured in the presence or absence of Doxy for 3 days. g, Phase contrast imaging of the clone-2 cells cultured in the absence of Doxy for 0-6 days. Scale bars (f-g), 100 μm.
Figure 2
Figure 2
BMI1 suppresses cell death by stabilizing cyclin E1. a, Immunoblot analysis of cyclins and CDKs in pooled BMI1-sensitive clones following BMI1 knockdown. α-tubulin levels are shown as loading control. b, Immunoblot analysis of cyclin E1 levels in BE(2)-C cells either uninfected (parental) or infected with retroviruses expressing shRNA sequences against GFP (GFPsh) or different regions of CCNE1 (CCNE1sh-80 and -81). Cyclin E1 levels were quantified against α-tubulin and are presented as the fraction of the cyclin E1 level in parental cells. c, Crystal violet staining of BE(2)-C cells expressing either GFPsh or CCNE1sh-80. d, Immunoblot analysis of BMI1 and cyclin E1 levels in pooled BMI1-sensitive clones infected with retroviruses expressing either GFP or Myc-cyclin E1 and cultured in the presence or absence of Doxy for 3 days. α-tubulin levels are shown as loading control. e, Phase contrast imaging of pooled BMI1-sensitive clones expressing either GFP or Myc-cyclin E1 and cultured in the presence or absence of Doxy for 6 days. Scale bars, 100 μm. f, qRT-PCR analysis of CCND1 and CCNE1 mRNA levels in pooled BMI1-sensitive cells cultured in the presence or absence of Doxy for 3 days (error bars, s.d., n=3). g, Quantification of cyclin E1 half-life in pooled BMI1-sensitive clones cultured in the presence or absence of Doxy for 3 days. Samples were collected at various time points following addition of cycloheximide (CHX) for immunoblot analysis. Cyclin E1 levels were quantified against α-tubulin and are presented as the fraction of the initial levels at time zero (error bars, s.d., n=4). h, In vivo ubiquitination assay of pooled BMI1-sensitive cells cultured in the presence or absence of Doxy for 3 days and co-transfected with Flag-ubiquitin and Myc-cyclin E1 expression plasmids. Polyubiquitinated cyclin E1 was detected by immunoprecipitation of Myccyclin E1, followed by immunoblotting for Flag-ubiquitin.
Figure 3
Figure 3
BMI1 represses FBXW7 expression. a, qRT-PCR analysis of FBXW7 and SKP2 mRNA levels in pooled BMI1-sensitive cells cultured in the presence or absence of Doxy for 3 days (error bars, s.d., n=3). b, ChIP-qPCR analysis showing association of BMI1 with the FBXW7 locus in pooled BMI1-sensitive clones in the presence of Doxy (error bars, s.d., n=3). The association of BMI1 with HOXA2, a known BMI1 target gene, is shown as positive control. BMI1 does not bind to the CCNB1 promoter, which is shown as negative control. c, qRT-PCR analysis of FBXW7 mRNA levels in pooled BMI-sensitive cells either uninfected or infected with lentiviruses expressing shRNA against GFP or different regions of FBXW7 and cultured in the presence or absence of Doxy for 3 days (error bars, s.d., n=3). d, Immunoblot analysis of cyclins A2 and E1 levels in the cells described in (c). Cyclin E1 levels were quantified against α-tubulin and are presented as the fraction of the cyclin E1 level in the presence of Doxy. e, Crystal violet staining of pooled BMI-sensitive cells expressing GFP-shRNA, FBXW7-shRNA-55 or -56 and cultured in the presence or absence of Doxy for 6 days.
Figure 4
Figure 4
MYCN counteracts the effect of BMI1 knockdown. a, Immunoblot analysis of MYCN and BMI1 levels in parental and Tet repressor (Tet-Off)-expressing BE(2)-C cells, and in individual BE(2)-C clones with inducible expression of BMI1 shRNA. The cells were cultured in the presence of Doxy. α-tubulin levels are shown as loading control. b, Immunoblot analysis of BMI1, MYCN and cyclin E1 levels in BMI1-resistant clone-7 and -12 cells cultured in the presence or absence of Doxy for 4 days. β-actin levels are shown as loading control. c, qRT-PCR analysis of FBXW7 mRNA levels in clone-7 and -12 cells cultured in the presence or absence of Doxy for 3 days (error bars, s.d., n=3). d, Immunoblot analysis of BMI1, MYCN and cyclin E1 levels in pooled BMI1-sensitive cells cultured in the presence or absence of Doxy for 5 and 35 days, respectively. β-actin levels are shown as loading control. e, Immunoblot analysis of BMI1, MYCN and cyclin E1 levels in pooled BMI1-sensitive cells infected with retroviruses expressing either GFP or MYCN and cultured in the presence or absence of Doxy for 4 days. β-actin levels are shown as loading control. f, Phase contrast imaging of pooled BMI1-sensitive cells expressing either GFP or MYCN and cultured in the presence or absence of Doxy for 6 days. Scale bars, 100 μm.
Figure 5
Figure 5
MYCN activates CCNE1 transcription. a, qRT-PCR analysis of cyclin mRNA levels in SHEP1 cells infected with retroviruses expressing either GFP or MYCN (error bars, s.d., n=3). Two-tailed Student's t-test analysis revealed only significant upregulation of CCNE1 mRNA. b, Immunoblot analysis of cyclin E1 and MYCN levels in SHEP1 cells expressing either GFP or MYCN. Levels of cyclin E1 were quantified against β-actin with the cyclin E1 level in GFP-expressing SHEP1 cells being designated as 1.0. c, Scatter dot plots of CCNE1 expression levels in primary neuroblastomas with or without MYCN amplification. The data were analyzed using two-tailed Student's t-test with p values indicated.
Figure 6
Figure 6
High CCNE1 expression is associated with Stage 4 neuroblastomas and poor outcome in neuroblastoma patients. a-b, Kaplan-Meier analysis of progression-free survival for Oberthuer (a) and Khan (b) datasets with log-rank test p values indicated. The CCNE1 expression cutoff value 0 (a) or 0.031 (b) was determined by the online Oncogenomics algorithm, which separated the patients into high and low CCNE1 expression groups. c-d, Scatter dot plot of CCNE1 expression levels in stage (ST) 1-4S (c) or 1-4 (d) tumors. Data were analyzed using two-tailed Student`s t-test with p values indicated (ST1 vs ST2, 3, 4 or 4S).
Figure 7
Figure 7
A model for the distinct mechanisms by which BMI1 and MYCN maintain cyclin E1 levels in neuroblastoma cells.

Similar articles

Cited by

References

    1. Asgharzadeh S, Pique-Regi R, Sposto R, Wang H, Yang Y, Shimada H, et al. Prognostic significance of gene expression profiles of metastatic neuroblastomas lacking MYCN gene amplification. J Natl Cancer Inst. 2006;98:1193–1203. - PubMed
    1. Brodeur GM. Neuroblastoma: biological insights into a clinical enigma. Nat Rev Cancer. 2003;3:203–216. - PubMed
    1. Bruggeman SW, Valk-Lingbeek ME, van der Stoop PP, Jacobs JJ, Kieboom K, Tanger E, et al. Ink4a and Arf differentially affect cell proliferation and neural stem cell self-renewal in Bmi1-deficient mice. Genes Dev. 2005;19:1438–1443. - PMC - PubMed
    1. Chang H-H, Lee H, Hu M-K, Tsao P-N, Juan H-F, Huang M-C, et al. Notch1 Expression Predicts an Unfavorable Prognosis and Serves as a Therapeutic Target of Patients with Neuroblastoma. Clinical Cancer Research. 2010;16:4411–4420. - PubMed
    1. Chen QR, Song YK, Wei JS, Bilke S, Asgharzadeh S, Seeger RC, et al. An integrated cross-platform prognosis study on neuroblastoma patients. Genomics. 2008;92:195–203. - PMC - PubMed

Publication types

MeSH terms

Substances