

Combined histone deacetylase and cyclooxygenase inhibition achieves enhanced antiangiogenic effects in lung cancer cells
- PMID: 22121107
- PMCID: PMC3980866
- DOI: 10.1002/mc.21846
Combined histone deacetylase and cyclooxygenase inhibition achieves enhanced antiangiogenic effects in lung cancer cells
Abstract
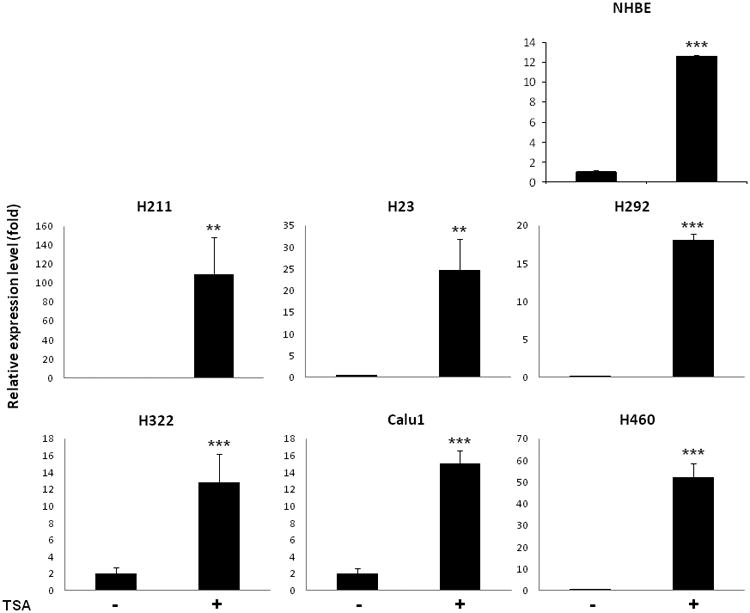
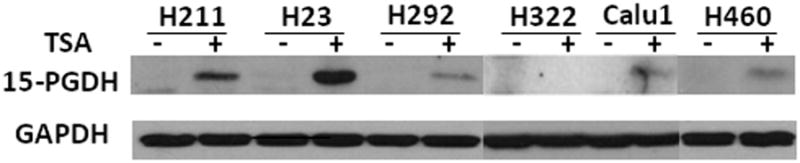
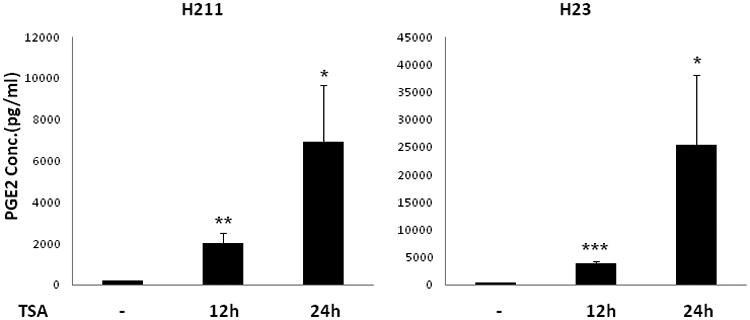
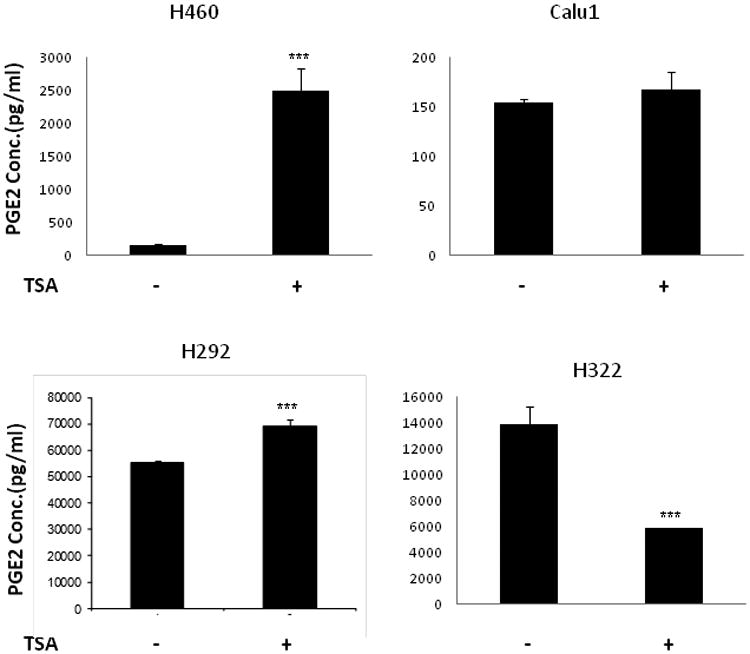
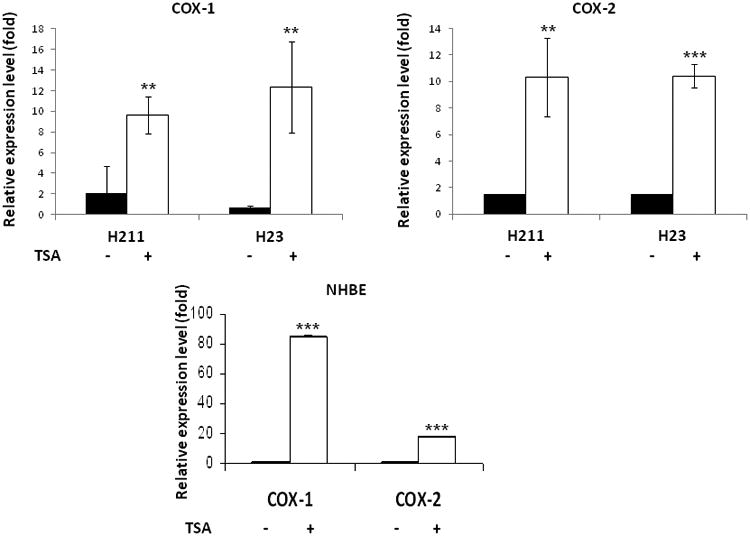
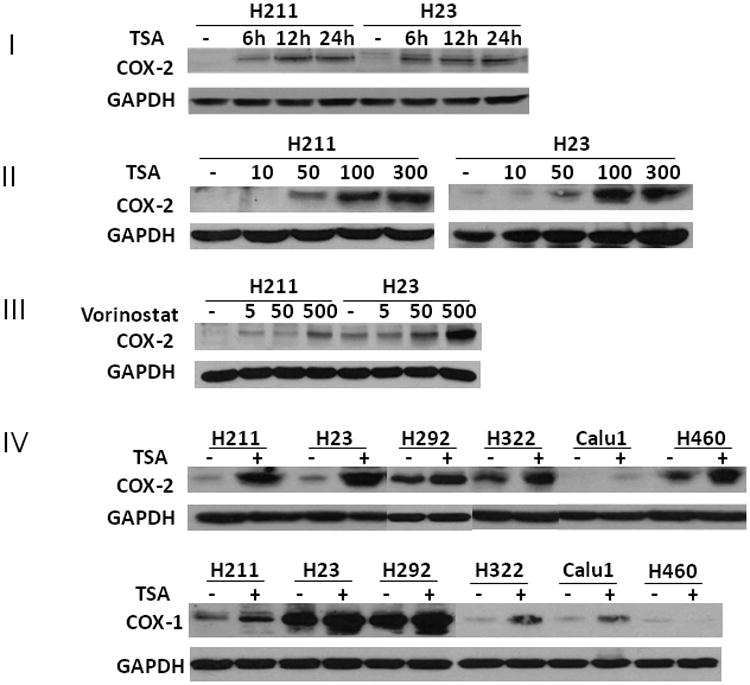
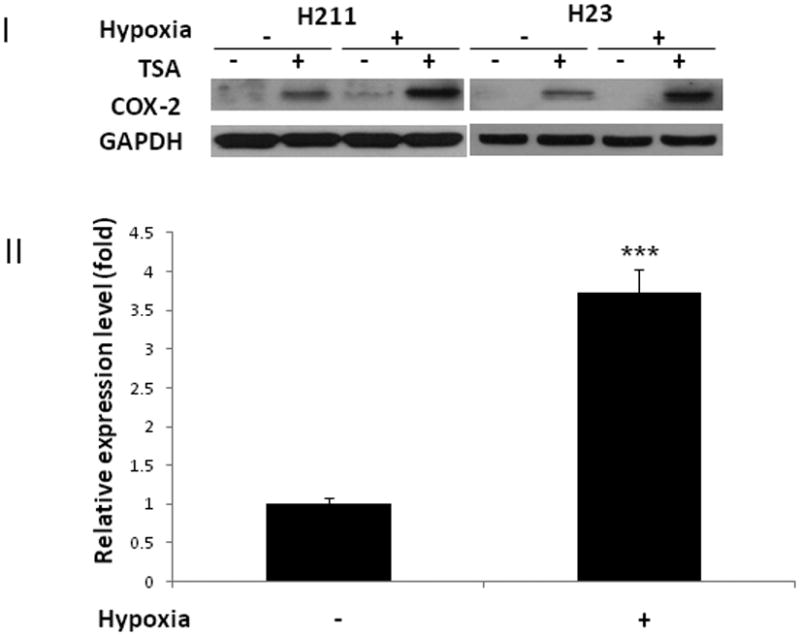
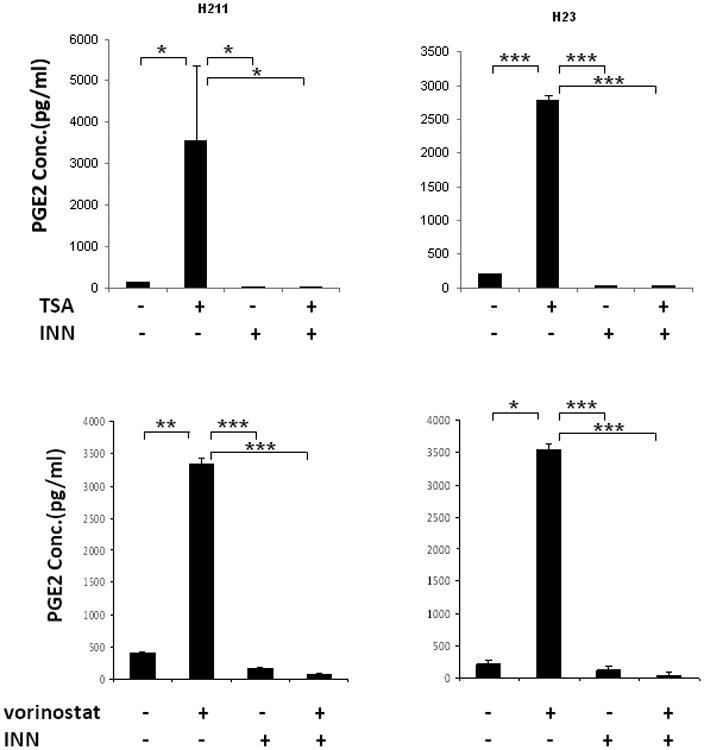
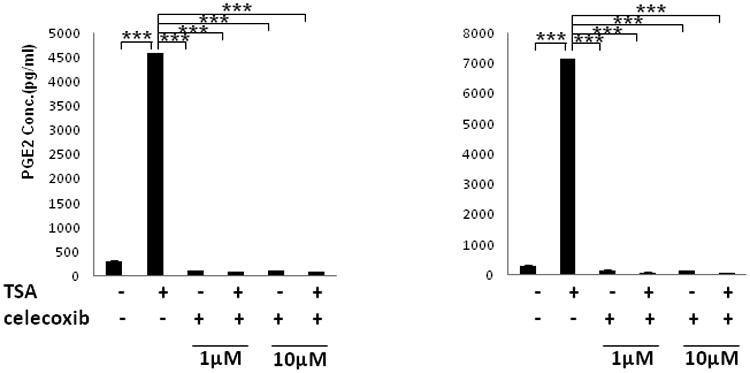
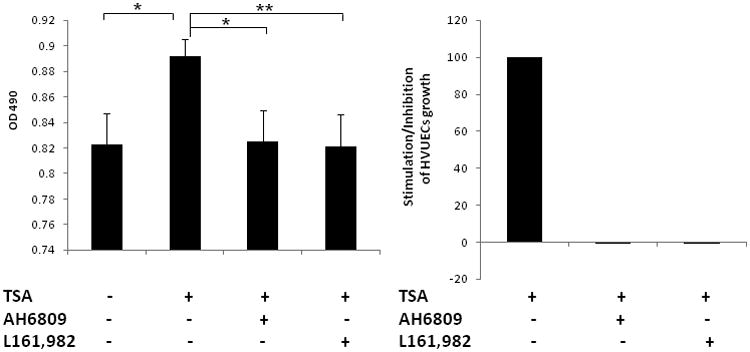
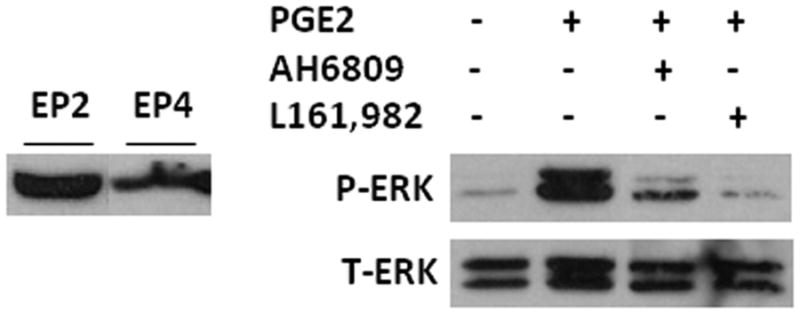
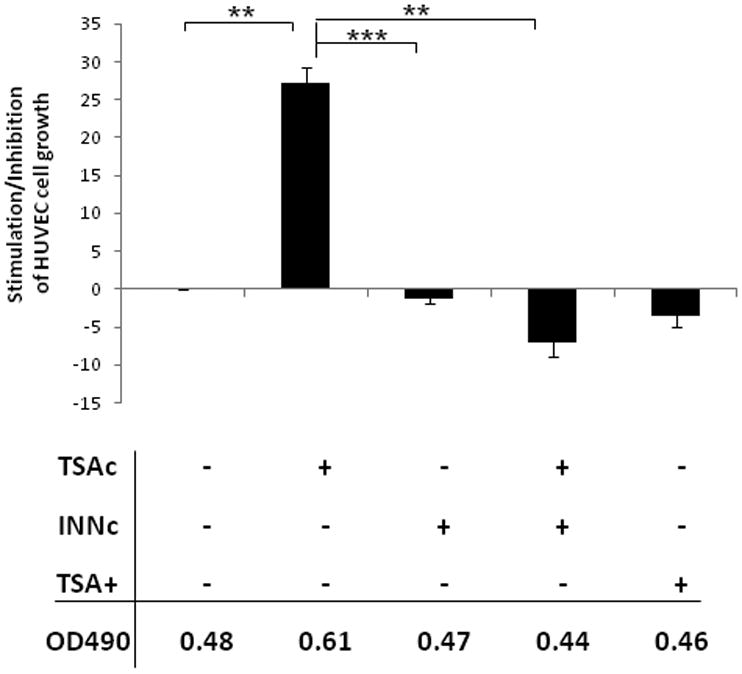
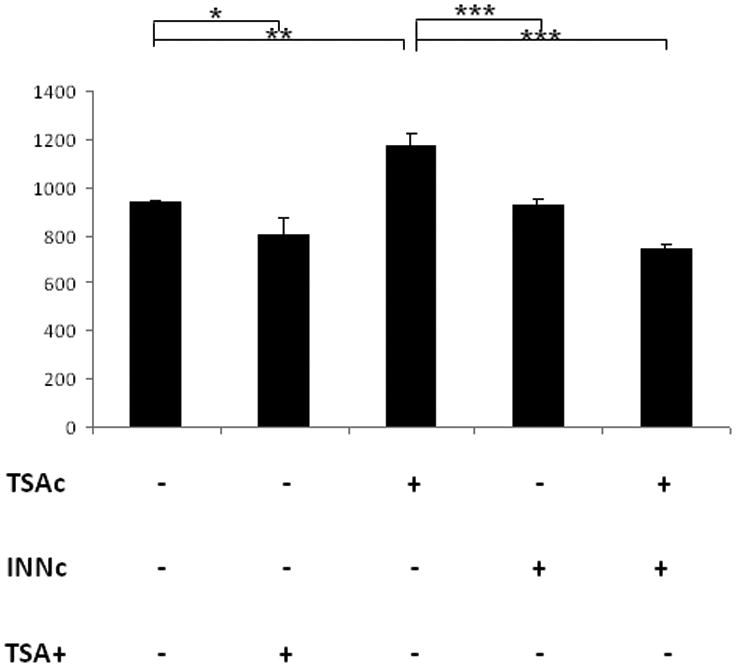
Prostaglandin E2 (PGE2) is an important pro-angiogenic and pro-proliferative cytokine and the key enzymes modulating its levels, cyclooxygenase (COX)-2 and 15-hydroxyprostaglandin dehydrogenase (15-PGDH) play important opposing roles in carcinogenesis. Previously we found loss of 15-PGDH expression in lung cancer and its reactivation leads to strong in vivo tumor-suppressive effect via an antiangiogenic mechanism. Here, we find that HDAC inhibitors (HDACI), such as trichostatin A (TSA) and vorinostat could reactivate 15-PGDH expression but overall induce PGE2 generation and this is the result of concomitant induction of COX-1 and -2 leading to functional promotion of endothelial cell proliferation and capillary formation. Direct TSA treatment inhibits endothelial cell proliferation and capillary formation in our study in line with prior reports as HDACIs have been shown to directly inhibit angiogenesis. The elevation of PGE2 levels induced by HDACI is potently neutralized by indomethacin (INN) or Celecoxib co-treatment and accordingly, angiogenesis is more effectively inhibited when using conditioned medium of co-treatment than either alone confirming that this effect is mediated via the PGE2 axis. Accordingly, blockage of EP2/4 receptors mitigates the stimulation of angiogenesis by excessive PGE2 generation mediated by TSA. In this study, we identify a potentially adverse effect of HDACIs through induction of both 15-PGDH and COX-2 leading to elevated PGE2 levels and thereby stimulation of angiogenesis. Co-treatment of TSA and INN shows more potent anti-angiogenic effects by inducing 15-PGDH and inhibiting COX-2. Overall, our results suggest that combined HDACI and COX inhibition should be explored clinically to achieve more meaningful benefits from HDACI therapy in lung cancer.
Copyright © 2011 Wiley Periodicals, Inc.
Figures
Similar articles
-
Celecoxib enhances the efficacy of 15-hydroxyprostaglandin dehydrogenase gene therapy in treating murine breast cancer.J Cancer Res Clin Oncol. 2013 May;139(5):797-807. doi: 10.1007/s00432-013-1381-9. Epub 2013 Feb 6. J Cancer Res Clin Oncol. 2013. PMID: 23385883 Free PMC article.
-
Modulation of CXCR3 ligand secretion by prostaglandin E2 and cyclooxygenase inhibitors in human breast cancer.Breast Cancer Res. 2012 Feb 14;14(1):R30. doi: 10.1186/bcr3115. Breast Cancer Res. 2012. PMID: 22333315 Free PMC article.
-
Sulindac reversal of 15-PGDH-mediated resistance to colon tumor chemoprevention with NSAIDs.Carcinogenesis. 2015 Feb;36(2):291-8. doi: 10.1093/carcin/bgu241. Epub 2014 Dec 10. Carcinogenesis. 2015. PMID: 25503930 Free PMC article.
-
Regulation of 15-hydroxyprostaglandin dehydrogenase (15-PGDH) by non-steroidal anti-inflammatory drugs (NSAIDs).Prostaglandins Other Lipid Mediat. 2011 Nov;96(1-4):37-40. doi: 10.1016/j.prostaglandins.2011.06.005. Epub 2011 Jul 6. Prostaglandins Other Lipid Mediat. 2011. PMID: 21763448 Review.
-
Multiple roles of COX-2 in tumor angiogenesis: a target for antiangiogenic therapy.Semin Oncol. 2004 Apr;31(2 Suppl 7):2-11. doi: 10.1053/j.seminoncol.2004.03.040. Semin Oncol. 2004. PMID: 15179620 Review.
Cited by
-
Tasquinimod Is an Allosteric Modulator of HDAC4 survival signaling within the compromised cancer microenvironment.Cancer Res. 2013 Feb 15;73(4):1386-99. doi: 10.1158/0008-5472.CAN-12-2730. Epub 2012 Nov 13. Cancer Res. 2013. PMID: 23149916 Free PMC article.
-
A knowledge graph to interpret clinical proteomics data.Nat Biotechnol. 2022 May;40(5):692-702. doi: 10.1038/s41587-021-01145-6. Epub 2022 Jan 31. Nat Biotechnol. 2022. PMID: 35102292 Free PMC article.
-
Quercetin enhances the antitumor activity of trichostatin A through upregulation of p53 protein expression in vitro and in vivo.PLoS One. 2013;8(1):e54255. doi: 10.1371/journal.pone.0054255. Epub 2013 Jan 16. PLoS One. 2013. PMID: 23342112 Free PMC article.
-
PARP inhibition selectively increases sensitivity to cisplatin in ERCC1-low non-small cell lung cancer cells.Carcinogenesis. 2013 Apr;34(4):739-49. doi: 10.1093/carcin/bgs393. Epub 2012 Dec 28. Carcinogenesis. 2013. PMID: 23275151 Free PMC article.
-
Expression Profiling Identifies Bezafibrate as Potential Therapeutic Drug for Lung Adenocarcinoma.J Cancer. 2015 Sep 20;6(12):1214-21. doi: 10.7150/jca.12191. eCollection 2015. J Cancer. 2015. PMID: 26535062 Free PMC article.
References
-
- Holla VR, Backlund MG, Yang P, Newman RA, DuBois RN. Regulation of prostaglandin transporters in colorectal neoplasia. Cancer Prev Res (Phila Pa) 2008;1(2):93–99. - PubMed
-
- Tai HH, Cho H, Tong M, Ding Y. NAD+-linked 15-hydroxyprostaglandin dehydrogenase: structure and biological functions. Curr Pharm Des. 2006;12(8):955–962. - PubMed
-
- Anggard E, Larsson C, Samuelsson B. The distribution of 15-hydroxy prostaglandin dehydrogenase and prostaglandin-delta 13-reductase in tissues of the swine. Acta Physiol Scand. 1971;81(3):396–404. - PubMed
-
- Moreno J, Krishnan AV, Swami S, Nonn L, Peehl DM, Feldman D. Regulation of prostaglandin metabolism by calcitriol attenuates growth stimulation in prostate cancer cells. Cancer Res. 2005;65(17):7917–7925. - PubMed
Publication types
MeSH terms
Substances
Grants and funding
LinkOut - more resources
Full Text Sources
Medical
Research Materials
Miscellaneous
