. 2012 Mar 15;21(6):1272-86.
doi: 10.1093/hmg/ddr557. Epub 2011 Nov 25.

A meckelin-filamin A interaction mediates ciliogenesis

Affiliations

A meckelin-filamin A interaction mediates ciliogenesis

Matthew Adams et al. Hum Mol Genet. .

Abstract

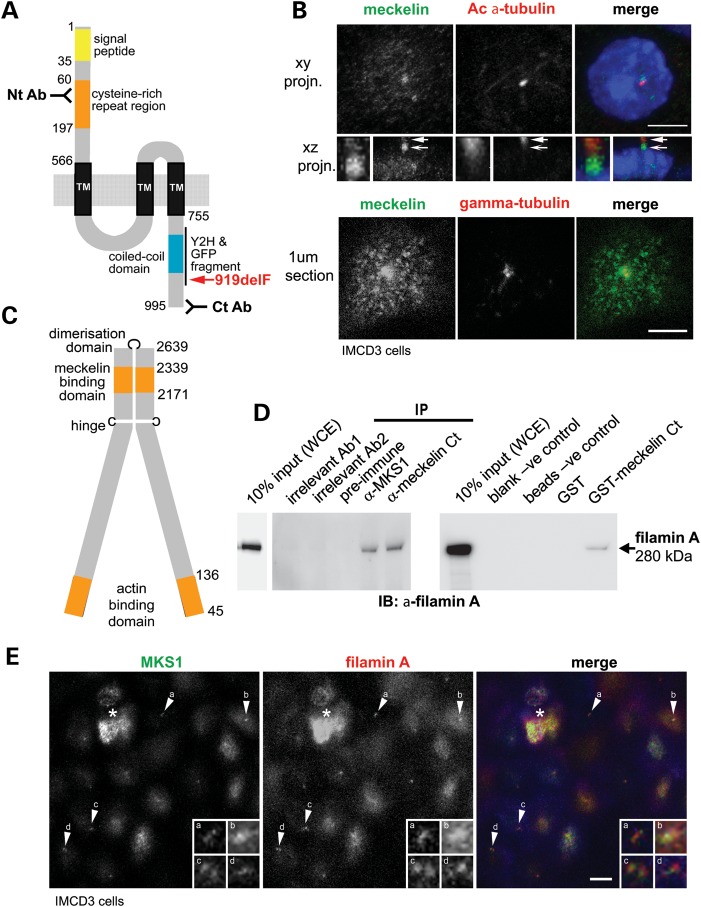
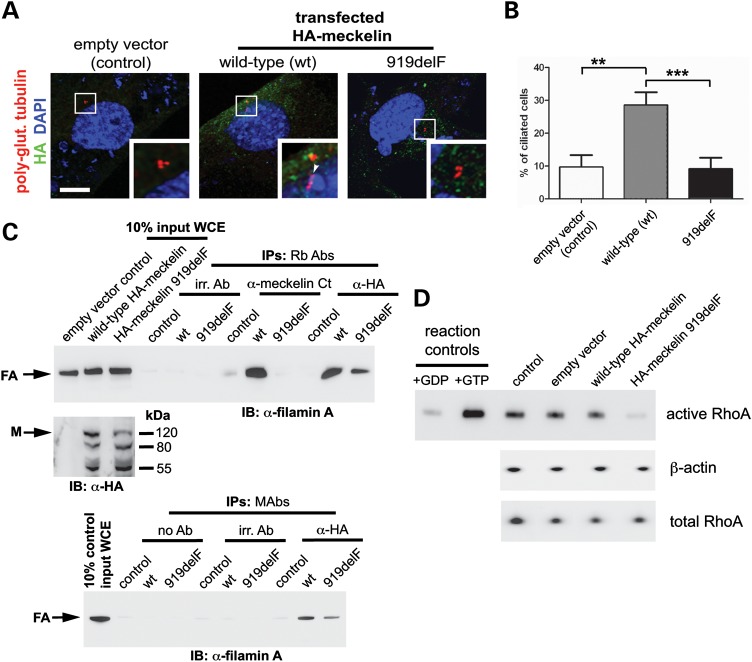
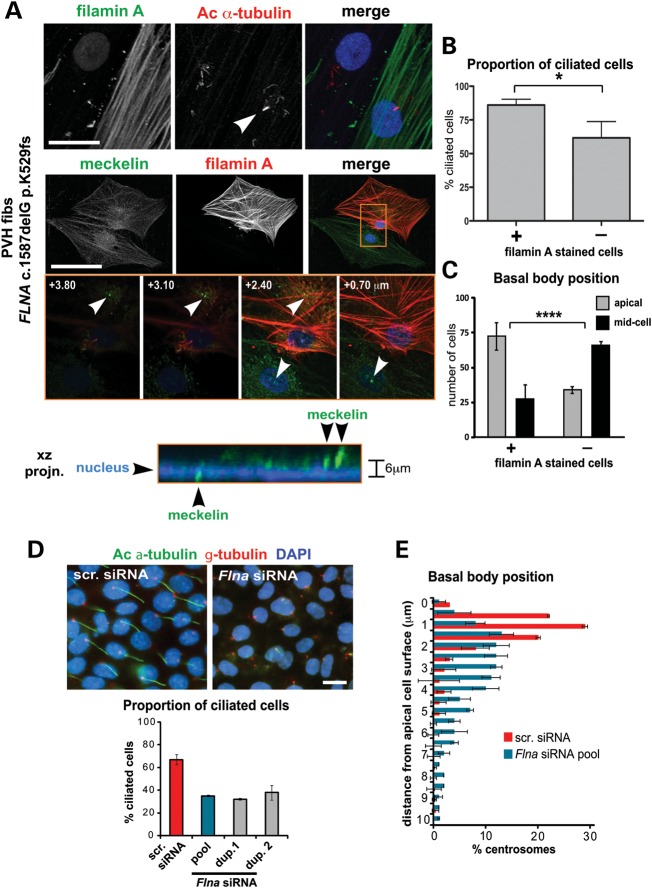
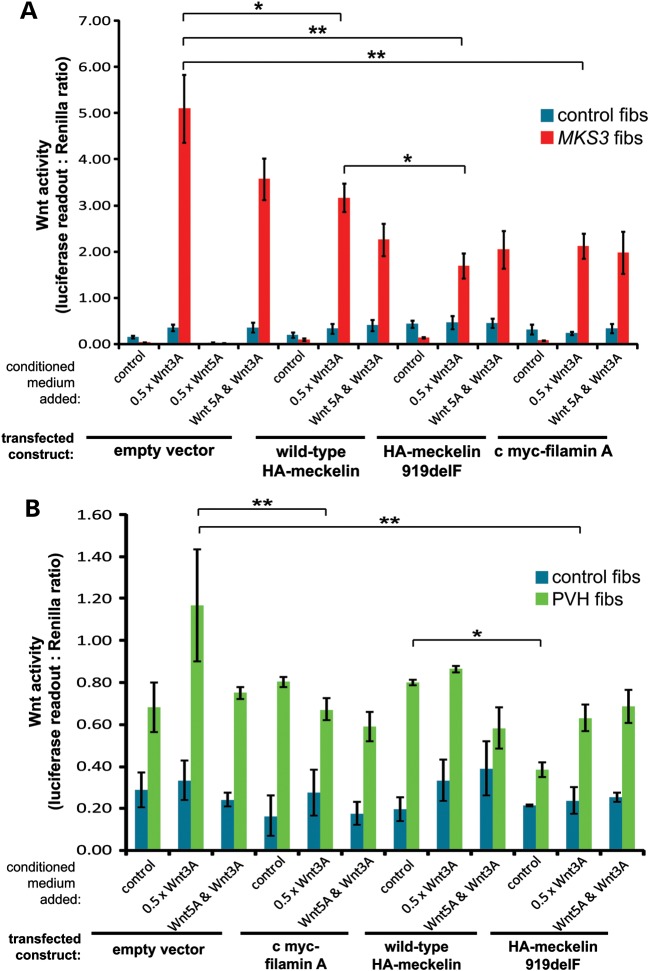
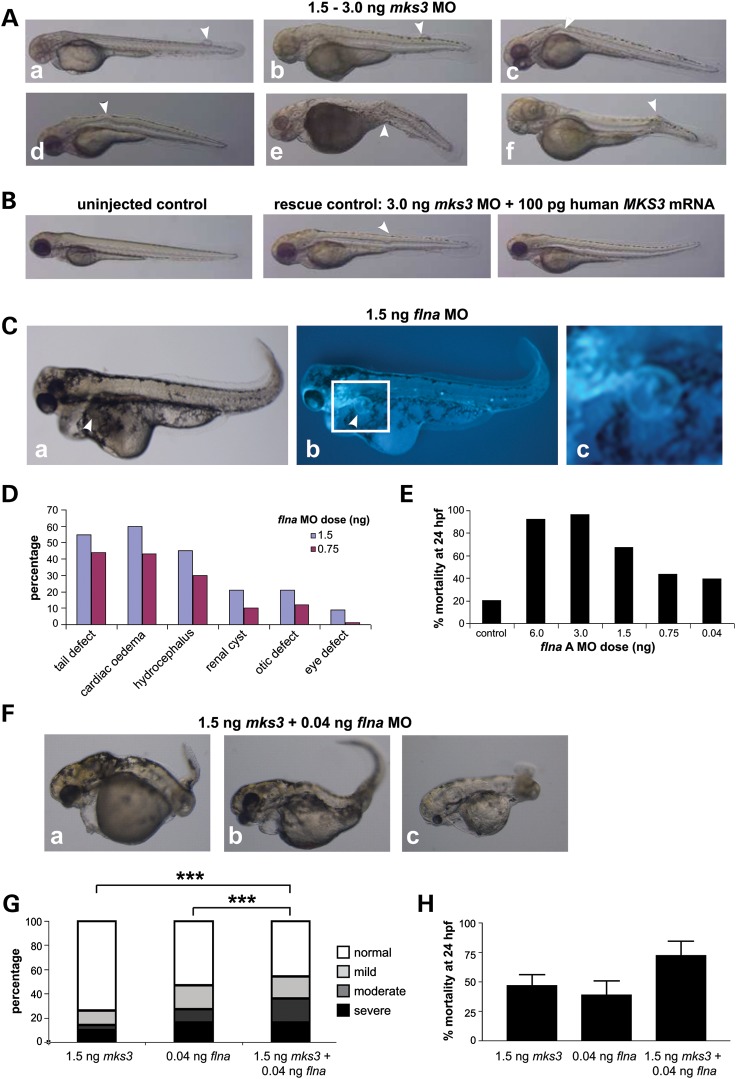
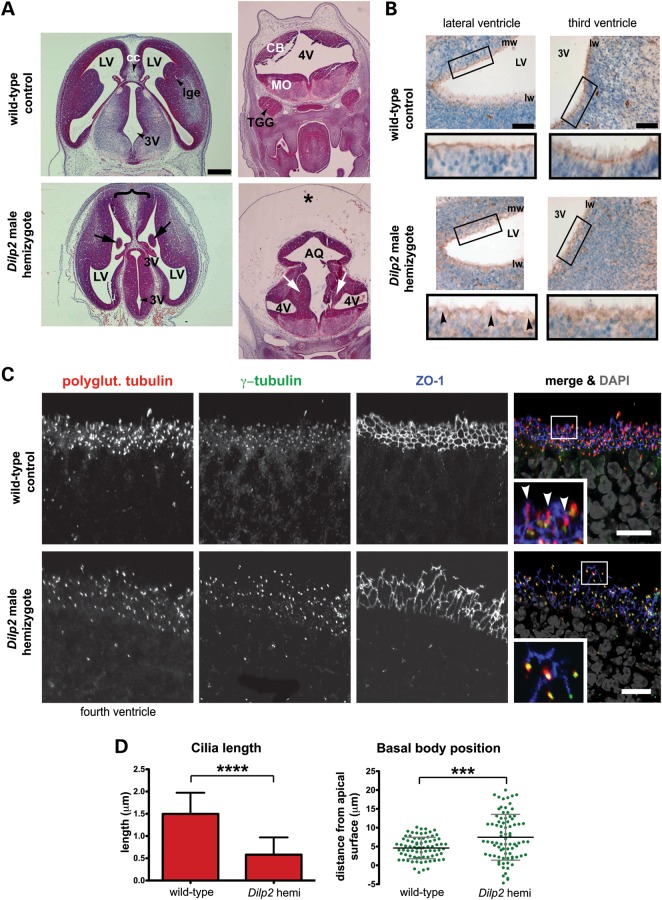
MKS3, encoding the transmembrane receptor meckelin, is mutated in Meckel-Gruber syndrome (MKS), an autosomal-recessive ciliopathy. Meckelin localizes to the primary cilium, basal body and elsewhere within the cell. Here, we found that the cytoplasmic domain of meckelin directly interacts with the actin-binding protein filamin A, potentially at the apical cell surface associated with the basal body. Mutations in FLNA, the gene for filamin A, cause periventricular heterotopias. We identified a single consanguineous patient with an MKS-like ciliopathy that presented with both MKS and cerebellar heterotopia, caused by an unusual in-frame deletion mutation in the meckelin C-terminus at the region of interaction with filamin A. We modelled this mutation and found it to abrogate the meckelin-filamin A interaction. Furthermore, we found that loss of filamin A by siRNA knockdown, in patient cells, and in tissues from Flna(Dilp2) null mouse embryos results in cellular phenotypes identical to those caused by meckelin loss, namely basal body positioning and ciliogenesis defects. In addition, morpholino knockdown of flna in zebrafish embryos significantly increases the frequency of dysmorphology and severity of ciliopathy developmental defects caused by mks3 knockdown. Our results suggest that meckelin forms a functional complex with filamin A that is disrupted in MKS and causes defects in neuronal migration and Wnt signalling. Furthermore, filamin A has a crucial role in the normal processes of ciliogenesis and basal body positioning. Concurrent with these processes, the meckelin-filamin A signalling axis may be a key regulator in maintaining correct, normal levels of Wnt signalling.


Figures

Figure 1.
Figure 1.
Meckelin localizes to the primary cilium and basal body and interacts with filamin. (A) Domain structure of meckelin showing the locations of predicted signal peptide, cysteine-rich repeat region, a region containing potential three to seven transmembrane domains (TM) and a coiled-coil domain. Indicated are the locations of epitopes for two anti-meckelin antibodies (‘Nt Ab’ and ‘Ct Ab’), the C-terminal region used for a Y2H bait fragment and a meckelin Ct-GFP construct, and the pathogenic MKS in-frame deletion mutation p.919delF (red). Numbering indicates the amino-acid residue. (B) Upper panels: Co-immunostaining and confocal microscopy of a ciliated mouse IMCD3 epithelial cell for meckelin (using the Nt Ab; green in merged image) and acetylated (Ac)-α-tubulin antibody (red) showing co-localization of meckelin isoforms at the cilium. A confocal xy projection (planar projn.) and xz-side projection are shown. Enlarged insets (white frames) show detail of localization at the proximal region of the cilium (arrow) and the basal body (barbed arrow). Nuclear localization of 4′,6-diamidino-2-phenylindole (DAPI) is shown in blue. Scale bar, 5 µm. Lower panels: 1 μm confocal section of the apical cell surface following co-immunostaining for meckelin Ct (green) and γ-tubulin (red). At the apical surface, meckelin had a punctate distribution and strong peribasal body accumulation. Scale bar, 5 µm. (C) Domain structure of filamin A showing meckelin-binding domain, actin-binding domain, dimerization domain and hinge. Numbering indicates the amino-acid residue. (D) Left panel: IP of endogenous filamin A (size 280 kDa) from confluent HEK293 WCE with anti-meckelin Ct (‘Ct Ab’) and anti-MKS1 but not by pre-immune serum-negative control or two irrelevant antibodies (Ab1 and Ab2). Right panel: pull-down of filamin A from WCE by GST-tagged meckelin Ct but not by GST alone, or blank and beads only negative (−ve) controls. Western immunoblotting (IB) was with an anti-filamin A MAb. Ten percent of total input WCE is indicated. (E) Co-immunostaining and confocal microscopy of a ciliated mouse IMCD3 epithelial cell for MKS1 (a basal body marker; green in merged image) and filamin A (red) showing localization of filamin A to the basal body and apical cell surface. A 2 μm apical section is shown. Enlarged insets (white frames, labelled a–d) show detail of localization at the basal body (arrows a–d). Scale bar, 5 µm. The asterisk indicates a cell above the monolayer.
Figure 2.
Figure 2.
A pathogenic MKS3 mutation causes loss of cilia formation and disrupts the meckelin–filamin A interaction. (A) MKS3-null fibroblasts (12) were transfected with empty vector negative control (control), wild-type HA-meckelin (wt) or p.F919del mutant HA-meckelin (919delF) constructs and were immunostained for HA (green), polyglutamylated tubulin and DAPI. Cells transfected with wt-HA-meckelin had a primary cilium (indicated by an arrowhead in enlarged inset, white border), whereas in cells transfected with p.F919del mutant HA-meckelin, the primary cilium was absent (enlarged inset, white border). Scale bar, 5 µm. (B) Graph quantifying the proportion of ciliated cells in MKS3-null fibroblasts (14) transfected with empty vector negative control (control), wild-type HA-meckelin (wt) or p.F919del mutant HA-meckelin (919delF). Ten percent of control cells were ciliated, 29% of cells transfected with wild-type HA-meckelin were ciliated and 9% of cells transfected with p.F919del mutant HA-meckelin were ciliated. **P < 0.01; ***P < 0.001 (Student's t-test). For each transfected cell population, a minimum of 500 cells were counted from 10 separate fields of view. (C) IP of endogenous filamin A by wild-type meckelin HEK293 cells were transfected with empty vector negative control (control), wild-type HA-meckelin (wt) or p.F919del mutant HA-meckelin (919delF) constructs. Top panel: 10% of total input WCE for each IP is indicated. Affinity-purified ‘Ct Ab’ anti-meckelin antibody against the C-terminus and anti-HA rabbit polyclonal (Rb Abs) against epitope-tagged wild-type HA-meckelin preferentially pull-down endogenous filamin A (arrow). Expression of the p.F919del mutant HA-meckelin (919delF) abrogated or prevented interaction with filamin A. IP for empty vector negative control (control), no antibody (no Ab) control and irrelevant antibodies (irr. Ab.) did not pull-down filamin A. Middle panel: expression of HA-tagged proteins determined by immunoblotting (IB) with Rb Ab anti-HA full-length meckelin (size 110 kDa) is indicated (arrow). Other smaller isoforms (80 and 55 kDa) are also recognized (refer to Supplementary Material, Fig. S2B). Bottom panel: anti-HA mouse MAbs against epitope-tagged wild-type HA-meckelin preferentially pulls down endogenous filamin A (arrow). (D) Rho activation pull-down assay HEK293 cells transfected with empty vector, wild-type HA-meckelin and p.F919del mutant HA-meckelin constructs. Expression of mutant meckelin caused a decrease in levels of activated RhoA-GTP when compared with wild-type meckelin, empty vector and a transfection reagent only negative control (control). Total RhoA and β-actin are shown as loading controls. A positive control for the assay (+GTP; loading with non-hydrolysable GTPγS) and a negative control (+GDP; loading with GDP) are also shown.
Figure 3.
Figure 3.
Defects in basal body positioning and ciliogenesis following loss of filamin A. (A) Co-immunocytostaining and confocal microscopy of serum-starved immortalized dermal fibroblasts (fibs) from a female patient with PVH carrying the FLNA frameshift mutation c.1587delG p.K529fs. Upper panel: staining for filamin A (green) and acetylated (Ac) a-tubulin (red). A primary cilium in the filamin A-positive staining cell is indicated (arrowhead). Middle panel: staining for meckelin Ct (green) and filamin A (red), with insets (orange frame), showing confocal z-sections at the indicated heights (μm) above the basal substrate (scale bars, 10 µm). Lower panel: xz projection of inset (orange frame) showing position of meckelin (green) at the basal body in relation to the nucleus (DAPI; blue). The difference in relative basal body heights is indicated to the right of the panel. (B) Bar graph quantifying the proportion of ciliated cells in filamin A-positive and null PVH fibroblasts. Sixty-two percent of filamin A null cells (n = 176) had cilia when compared with 88% of filamin A-positive cells (n = 174, error bars = SEM, *P < 0.01, Student's t-test). (C) Bar graph quantifying the position of the basal body in filamin A-positive and null PVH fibroblasts. In filamin A null cells, the basal body was retained in the mid-portion of the cell (66.1%; n = 125, defined as present in the lowermost three-quarters of z-sections), whereas the majority of filamin A-positive cells had an apical basal body (72.4%; n = 133, error bars = SEM, ****P < 106, χ2- test). (D) Impairment of ciliogenesis in serum-starved IMCD3 cells following transfection with mouse filamin A (Flna) siRNA pooled duplexes (dup.) but not scrambled (scr.) control. Merged images show localization of cilia (acetylated a-tubulin, green), basal bodies (g-tubulin, red) and nuclei (DAPI, blue). Scale bar, 5 µm. Bar graph quantifies the percentage of ciliated cells following transfection with the indicated siRNAs. Values shown are means for n = 120 or greater, for three independent replicates with error bars indicating SEM. (E) Bar graph quantifying the percentage of centrosomes measured at the indicated distances from the apical cell surface in IMCD3 cells, following transfection with either scrambled (scr.) control siRNA (blue bars) or Flna siRNA pooled duplexes (red bars). Values shown are means for n = 1000 or greater, for three independent replicates with error bars indicating SEM.
Figure 4.
Figure 4.
Loss of meckelin or filamin A causes deregulation of Wnt signalling. (A) TopFlash assays to measure levels of activated β-catenin, and hence canonical Wnt signalling, following co-transfection of immortalized normal control (control fibs, blue bars) and MKS3-mutated dermal fibroblasts (MKS3 fibs, red bars; see Fig. 3C) with reporter constructs and empty vector, wild-type HA-meckelin, p.F919del mutant HA-meckelin constructs and c myc-filamin A, as indicated. The empty vector results combine the data from transfections with pCMV-HA and pCMV-c myc. Activity is expressed as ratios of luciferase reporter construct expression, normalized for loading by measurement of a Renilla construct expression. The responses are shown to 0.5 × L cell control conditioned media (control), and conditioned media containing expressed Wnt3A and/or Wnt5A. Values shown are means of at least four independent replicates, with error bars indicating SEM. Statistical significance of pair-wise comparisons are shown (*P < 0.01 and **P < 0.001, Student's t-test). (B) TopFlash reporter assays as in (A) for control fibroblasts (control fibs, blue bars) and FLNA-mutated fibroblasts (FLNA fibs, green bars). Values shown are means of three independent replicates. Statistical significance of pair-wise comparisons are shown (*P < 0.05, error bars = SEM, **P < 0.01, Student's t-test).
Figure 5.
Figure 5.
Increases in the severity and incidence of ciliopathy developmental defects in zebrafish embryos following morpholino oligonucleotide knockdown of both mks3 and flna expression. (A) Meckelin is required for development of the notochord in zebrafish embryos following morpholino oligonucleotide (MO) knockdown of mks3 by microinjection at 72 hpf for MO doses 1.5–3.0 ng. Morphant phenotype typical of ciliopathy zebrafish embryo models include (panels a and b) meningocele formation, (c and d) proximal and (e and f) distal notochord abnormalities (arrowheads). (B) Normal uninjected control (left panel), and almost complete rescue of the phenotype (middle and right panels) seen with co-injection of human MKS3 mRNA (100 pg) and mks3 MO (3 ng dose). A mild notochord defect is indicated (arrowhead). (C) Pronephric cyst formation in filamin A (flna) MO-injected embryos (1.5 ng dose) at 72 hpf, seen under light (panel a) and fluorescence microscopy (b, in claudin-B-GFP transgenic fish; c indicates magnified inset in white frame). RT-PCR confirmed abnormal splicing of flna transcripts (data not shown). (D) Percentage incidence and range of morphant phenotypes in flna MO-injected embryos (1.5 and 0.75 ng doses) at 72 hpf. Numbers of embryos were 69 for 1.5 ng and 81 for 0.75 ng. (E) Dose-dependant effect on mortality at 24 hpf seen with increasing dose (0.04–6 ng) of flna MO. Number of embryos: control = 1428; Fil A: 6 ng = 133, 3 ng = 99, 1.5 ng = 428, 0.75 ng = 584, 0.04 ng = 487). (F) Combined low doses of mks3 MO (1.5 ng) and flna MO (0.04 ng) produced an increase in frequency and severity of developmental defects with (panel a) severe brain and body axis defects, (b) cardiac oedema, (c) otic placode and eye defects. (G) Comparison of morphant phenotype percentage incidences for mks3 MO only (n = 248), flna MO only (n = 129) and combined mks3 + flna MOs (n = 94) at 72 hpf. The y-axis represents the percentage of embryos displaying severe (black), moderate (dark grey), mild (light grey) and normal (white) phenotypes. Combined mks3 and flna MO treatments show increases in abnormal phenotypes in embryos surviving to 72 hpf. Statistical significance of pair-wise comparisons are shown (***P < 0.0001, χ2-test). (H) Increased mortality with combination mks3 (1.5 ng) and flna (0.04 ng) MO treatments seen at 24 hpf. Error bars indicate SEM.
Figure 6.
Figure 6.
Defects in meckelin localization in neuroepithelial cells of FlnaDilp2 E13.5 mouse embryos mutant for filamin A. (A) Comparable transverse sections of male wild-type and FlnaDilp2 hemizygote embryonic E13.5 brains stained with haematoxylin and eosin, showing normal morphology of the lateral ventricles (LV) and third ventricles (3V) in wild-type controls. The FlnaDilp2 brain has a broad mid-line (brace), intraventricular heterotopias (arrows), fusion of the fourth ventricle (4V) with the aqueduct (AQ) and the presence of severe oedema (*). CB, cerebellum; MO, medulla oblongata. Scale bar, 0.3 mm. (B) Immunohistochemical staining for meckelin Ct (brown) in neuroepithelial cells of the lateral ventricles (LV; top panels) and third ventricles (3V; bottom panels) for male wild-type matched controls (left-hand panels) and FlnaDilp2 (right-hand panels) E13.5 embryo brain sections. Nuclei are stained with Mayer's haematoxylin (blue). Note the diffuse localization of meckelin Ct in FlnaDilp2 neuroepithelia (magnified insets in black frames). PVH of neurons is indicated by arrowheads. mw, medial wall, lw, lateral wall. Scale bars, 50 μm. (C) Co-immunocytostaining and confocal microscopy of neuroepithelial cells of the third ventricles for adjacent sections to those shown in (B). Stainings are for polyglutamylated tubulin (red), γ-tubulin (green) and ZO-1 (blue) to visualize the cell cortex. The enlarged insets (white border) show cilia in the wild-type controls (arrowheads). Note the disruption of the ZO-1-stained cell cortex in FlnaDilp2 mutant cells. Scale bar, 10 µm. (D) Upper graph: quantifying cilia length in neuroepithelial cells of the lateral ventricles of male mouse embryo hemizygous for the FlnaDilp2 mutation in Flna, and male wild-type controls. Mean cilia length was 1.5 μm in wild-type controls and 0.6 μm in FlnaDilp2 mutated cells. ****P < 0.0001, Student's t-test. Lower graph: quantifying basal body position relative to the apical cell surface (marked by ZO-1 immunostaining) in neuroepithelial cells of the lateral ventricles of a male embryo hemizygous for the FlnaDilp2, and male wild-type controls. Basal body position was between −1 and 11 μm in wild-type controls and between −5 and +21 μm in FlnaDilp2 mutated cells. ***P < 0.001, Student's t-test.

References

    1. Baala L., Audollent S., Martinovic J., Ozilou C., Babron M.C., Sivanandamoorthy S., Saunier S., Salomon R., Gonzales M., Rattenberry E., et al. Pleiotropic effects of CEP290 (NPHP6) mutations extend to Meckel syndrome. Am. J. Hum. Genet. 2007;81:170–179. doi:, doi:10.1086/519494. - DOI - PMC - PubMed
    1. Kyttala M., Tallila J., Salonen R., Kopra O., Kohlschmidt N., Paavola-Sakki P., Peltonen L., Kestila M. MKS1, encoding a component of the flagellar apparatus basal body proteome, is mutated in Meckel syndrome. Nat. Genet. 2006;38:155–157. doi:10.1016/S0022-0981(03)00271-5, doi:10.1038/ng1714. - DOI - DOI - PubMed
    1. Smith U.M., Consugar M., Tee L.J., McKee B.M., Maina E.N., Whelan S., Morgan N.V., Goranson E., Gissen P., Lilliquist S., et al. The transmembrane protein meckelin (MKS3) is mutated in Meckel–Gruber syndrome and the wpk rat. Nat. Genet. 2006;38:191–196. doi:10.1080/00222939000770621, doi:10.1038/ng1713. - DOI - DOI - PubMed
    1. Valente E.M., Logan C.V., Mougou-Zerelli S., Lee J.H., Silhavy J.L., Brancati F., Iannicelli M., Travaglini L., Romani S., Illi B., et al. Mutations in TMEM216 perturb ciliogenesis and cause Joubert, Meckel and related syndromes. Nat. Genet. 2010;42:619–625. doi:, doi:10.1038/ng.594. - DOI - PMC - PubMed
    1. Roume J., Genin E., Cormier-Daire V., Ma H.W., Mehaye B., Attie T., Razavi-Encha F., Fallet-Bianco C., Buenerd A., Clerget-Darpoux F., et al. A gene for Meckel syndrome maps to chromosome 11q13. Am. J. Hum. Genet. 1998;63:1095–1101. doi:10.1086/302062. - DOI - PMC - PubMed

Publication types

MeSH terms