

Fluorescence strategies for high-throughput quantification of protein interactions
- PMID: 22121211
- PMCID: PMC3299996
- DOI: 10.1093/nar/gkr1045
Fluorescence strategies for high-throughput quantification of protein interactions
Abstract
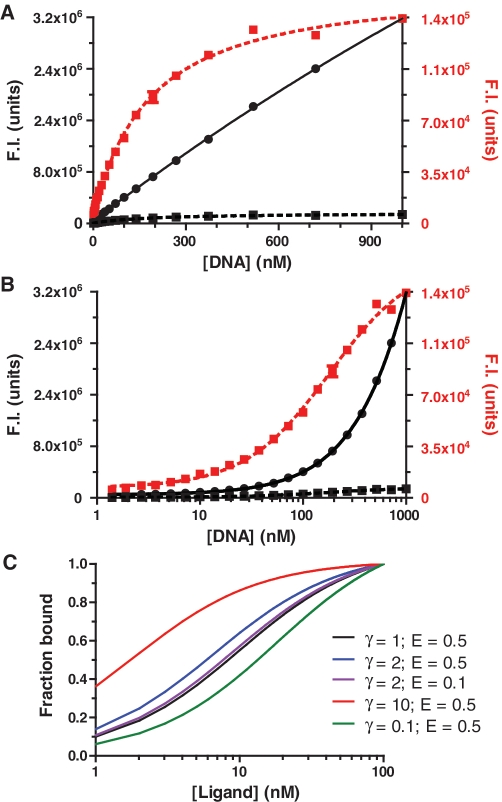
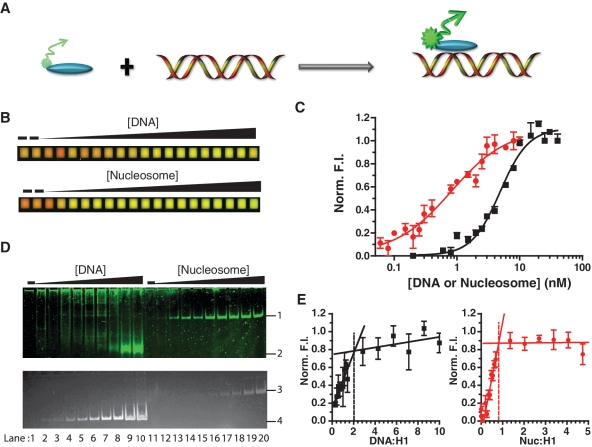
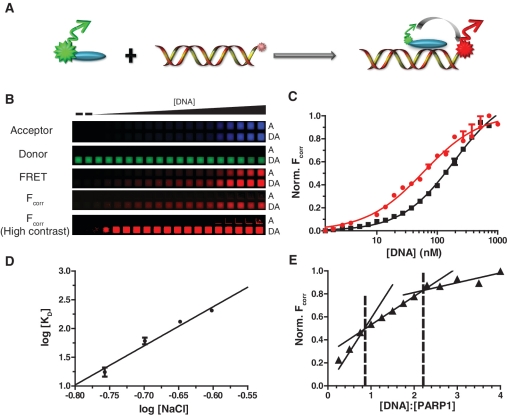
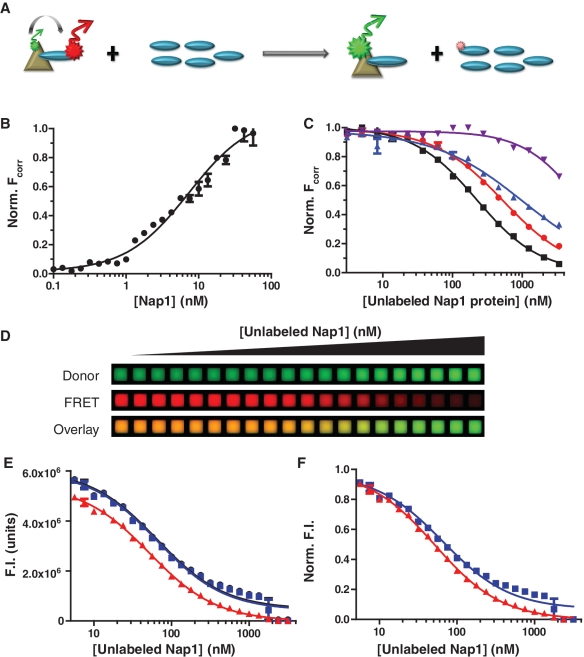
Advances in high-throughput characterization of protein networks in vivo have resulted in large databases of unexplored protein interactions that occur during normal cell function. Their further characterization requires quantitative experimental strategies that are easy to implement in laboratories without specialized equipment. We have overcome many of the previous limitations to thermodynamic quantification of protein interactions, by developing a series of in-solution fluorescence-based strategies. These methods have high sensitivity, a broad dynamic range, and can be performed in a high-throughput manner. In three case studies we demonstrate how fluorescence (de)quenching and fluorescence resonance energy transfer can be used to quantitatively probe various high-affinity protein-DNA and protein-protein interactions. We applied these methods to describe the preference of linker histone H1 for nucleosomes over DNA, the ionic dependence of the DNA repair enzyme PARP1 in DNA binding, and the interaction between the histone chaperone Nap1 and the histone H2A-H2B heterodimer.
Figures
Similar articles
-
Structural evidence for Nap1-dependent H2A-H2B deposition and nucleosome assembly.EMBO J. 2016 Jul 1;35(13):1465-82. doi: 10.15252/embj.201694105. Epub 2016 May 25. EMBO J. 2016. PMID: 27225933 Free PMC article.
-
Dynamics of nucleosome assembly and effects of DNA methylation.J Biol Chem. 2015 Feb 13;290(7):4291-303. doi: 10.1074/jbc.M114.619213. Epub 2014 Dec 29. J Biol Chem. 2015. PMID: 25550164 Free PMC article.
-
A coupled equilibrium approach to study nucleosome thermodynamics.Methods Enzymol. 2011;488:265-85. doi: 10.1016/B978-0-12-381268-1.00011-2. Methods Enzymol. 2011. PMID: 21195232
-
Yeast HMO1: Linker Histone Reinvented.Microbiol Mol Biol Rev. 2016 Nov 30;81(1):e00037-16. doi: 10.1128/MMBR.00037-16. Print 2017 Mar. Microbiol Mol Biol Rev. 2016. PMID: 27903656 Free PMC article. Review.
-
Mechanistic and structural insights into histone H2A-H2B chaperone in chromatin regulation.Biochem J. 2020 Sep 18;477(17):3367-3386. doi: 10.1042/BCJ20190852. Biochem J. 2020. PMID: 32941645 Review.
Cited by
-
Extranucleosomal DNA enhances the activity of the LSD1/CoREST histone demethylase complex.Nucleic Acids Res. 2015 May 26;43(10):4868-80. doi: 10.1093/nar/gkv388. Epub 2015 Apr 27. Nucleic Acids Res. 2015. PMID: 25916846 Free PMC article.
-
Linker histone H1.0 interacts with an extensive network of proteins found in the nucleolus.Nucleic Acids Res. 2013 Apr;41(7):4026-35. doi: 10.1093/nar/gkt104. Epub 2013 Feb 21. Nucleic Acids Res. 2013. PMID: 23435226 Free PMC article.
-
FRET-based Stoichiometry Measurements of Protein Complexes in vitro.Bio Protoc. 2018 Feb 5;7(3):e2713. doi: 10.21769/bioprotoc.2713. Bio Protoc. 2018. PMID: 29644254 Free PMC article.
-
Native Mass Spectrometry of Membrane Protein-Lipid Interactions in Different Detergent Environments.Anal Chem. 2024 Oct 22;96(42):16768-16776. doi: 10.1021/acs.analchem.4c03312. Epub 2024 Oct 12. Anal Chem. 2024. PMID: 39394983 Free PMC article.
-
Reversible chromatin condensation by the DNA repair and demethylation factor thymine DNA glycosylase.Nucleic Acids Res. 2021 Mar 18;49(5):2450-2459. doi: 10.1093/nar/gkab040. Nucleic Acids Res. 2021. PMID: 33733652 Free PMC article.
References
-
- Heeres JT, Hergenrother PJ. High-throughput screening for modulators of protein-protein interactions: use of photonic crystal biosensors and complementary technologies. Chem. Soc. Rev. 2010;40:4398–4410. - PubMed
Publication types
MeSH terms
Substances
Grants and funding
LinkOut - more resources
Full Text Sources
Molecular Biology Databases
Research Materials
Miscellaneous
