Measuring the Temporal Structure in Serially-Sampled Phylogenies
- PMID: 22121470
- PMCID: PMC3222587
- DOI: 10.1111/j.2041-210X.2011.00102.x
Measuring the Temporal Structure in Serially-Sampled Phylogenies
Abstract
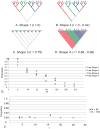
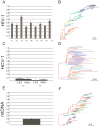
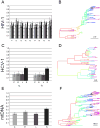
Nucleotide sequences sampled at different times (serially-sampled sequences) allow researchers to study the rate of evolutionary change and the demographic history of populations. Some phylogenies inferred from serially-sampled sequences are described as having strong 'temporal clustering', such that sequences from the same sampling time tend to to cluster together and to be the direct ancestors of sequences from the following sampling time. The degree to which phylogenies exhibit these properties is thought to reflect interesting biological processes, such as positive selection or deviation from the molecular clock hypothesis.Here we introduce the Temporal Clustering (TC) statistic, which is the first quantitative measure of the degree of topological 'temporal clustering' in a serially-sampled phylogeny. The TC statistic represents the expected deviation of an observed phylogeny from the null hypothesis of no temporal clustering, as a proportion of the range of possible values, and can therefore be compared among phylogeny of different sizes.We apply the TC statistic to a range of serially-sampled sequence datasets, which represent both rapidly-evolving viruses and ancient mitochondrial DNA. In addition, the TC statistic was calculated for phylogenies simulated under a neutral coalescent process.Our results indicate significant temporal clustering in many empirical datasets. However, we also find that such clustering is exhibited by trees simulated under a neutral coalescent process; hence the observation of significant 'temporal clustering' cannot unambiguously indicate that presence of strong positive selection in a population.Quantifying topological structure in this manner will provide new insights into the evolution of measurably evolving populations.
Figures


Similar articles
-
PhyloTempo: A Set of R Scripts for Assessing and Visualizing Temporal Clustering in Genealogies Inferred from Serially Sampled Viral Sequences.Evol Bioinform Online. 2012;8:261-9. doi: 10.4137/EBO.S9738. Epub 2012 Jun 11. Evol Bioinform Online. 2012. PMID: 22745529 Free PMC article.
-
The role of internal node sequences and the molecular clock in the analysis of serially-sampled data.Int J Bioinform Res Appl. 2008;4(1):107-21. doi: 10.1504/IJBRA.2008.017167. Int J Bioinform Res Appl. 2008. PMID: 18283032
-
Measuring Asymmetry in Time-Stamped Phylogenies.PLoS Comput Biol. 2015 Jul 6;11(7):e1004312. doi: 10.1371/journal.pcbi.1004312. eCollection 2015 Jul. PLoS Comput Biol. 2015. PMID: 26147205 Free PMC article.
-
Folic acid supplementation and malaria susceptibility and severity among people taking antifolate antimalarial drugs in endemic areas.Cochrane Database Syst Rev. 2022 Feb 1;2(2022):CD014217. doi: 10.1002/14651858.CD014217. Cochrane Database Syst Rev. 2022. PMID: 36321557 Free PMC article.
-
Understanding phylogenetic incongruence: lessons from phyllostomid bats.Biol Rev Camb Philos Soc. 2012 Nov;87(4):991-1024. doi: 10.1111/j.1469-185X.2012.00240.x. Epub 2012 Aug 14. Biol Rev Camb Philos Soc. 2012. PMID: 22891620 Free PMC article. Review.
Cited by
-
The antigenic evolution of influenza: drift or thrift?Philos Trans R Soc Lond B Biol Sci. 2013 Feb 4;368(1614):20120200. doi: 10.1098/rstb.2012.0200. Print 2013 Mar 19. Philos Trans R Soc Lond B Biol Sci. 2013. PMID: 23382423 Free PMC article.
-
Insights into the Impact of CD8+ Immune Modulation on Human Immunodeficiency Virus Evolutionary Dynamics in Distinct Anatomical Compartments by Using Simian Immunodeficiency Virus-Infected Macaque Models of AIDS Progression.J Virol. 2017 Nov 14;91(23):e01162-17. doi: 10.1128/JVI.01162-17. Print 2017 Dec 1. J Virol. 2017. PMID: 28931681 Free PMC article.
-
Extensive C->U transition biases in the genomes of a wide range of mammalian RNA viruses; potential associations with transcriptional mutations, damage- or host-mediated editing of viral RNA.PLoS Pathog. 2021 Jun 1;17(6):e1009596. doi: 10.1371/journal.ppat.1009596. eCollection 2021 Jun. PLoS Pathog. 2021. PMID: 34061905 Free PMC article.
-
Microevolution of Campylobacter jejuni during long-term infection in an immunocompromised host.Sci Rep. 2020 Jun 22;10(1):10109. doi: 10.1038/s41598-020-66771-7. Sci Rep. 2020. PMID: 32572150 Free PMC article.
-
The evolutionary dynamics of endemic human coronaviruses.Virus Evol. 2021 Mar 20;7(1):veab020. doi: 10.1093/ve/veab020. eCollection 2021 Jan. Virus Evol. 2021. PMID: 33768964 Free PMC article.
References
-
- Agapow P, Purvis A. Power of eight tree shape statistics to detect nonrandom diversification: a comparison by simulation of two models of cladogenesis. Syst Biol. 2002;51:866–872. - PubMed
-
- Bush R, Bender C, Subbarao K, Cox N, Fitch W. Predicting the evolution of human influenza A. Science. 1999;286:1921–1925. - PubMed
-
- Colless DH. Review of Phylogenetics: The Theory and Practice of Phylogenetic Systematics. Syst Zool. 1982;31:100–104.
-
- Drummond A, Pybus OG, Rambaut A. Inference of viral evolutionary rates from molecular sequences. Adv Parasitol. 2003;54:331–358. - PubMed
-
- Drummond AJ, Pybus OG, Rambaut A, Forsberg R, Rodrigo AG. Measurably evolving populations. Trends in Ecology and Evolution. 2003;18:481–488.
Grants and funding
LinkOut - more resources
Full Text Sources
