

A comparison of imaging techniques to monitor tumor growth and cancer progression in living animals
- PMID: 22121481
- PMCID: PMC3216304
- DOI: 10.1155/2011/321538
A comparison of imaging techniques to monitor tumor growth and cancer progression in living animals
Abstract
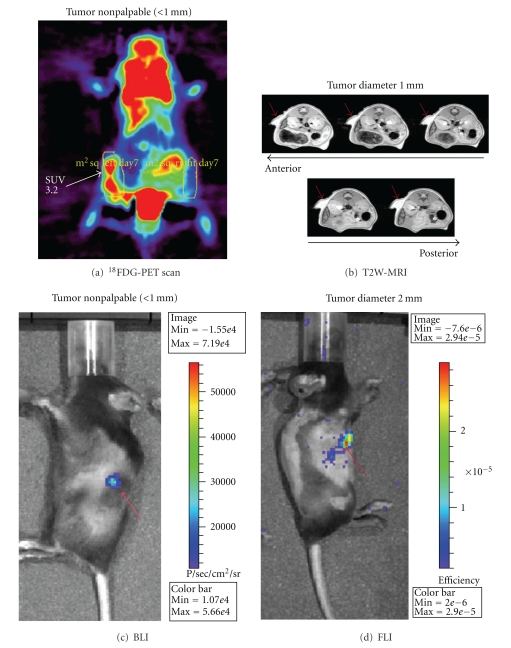
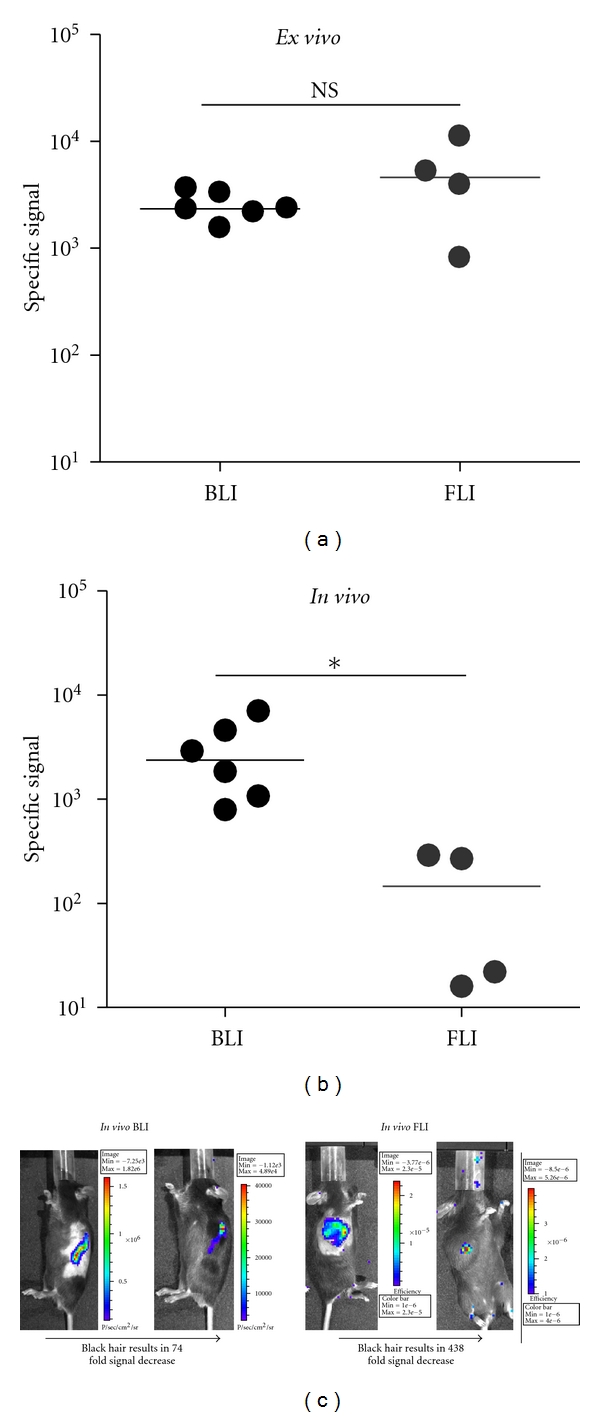
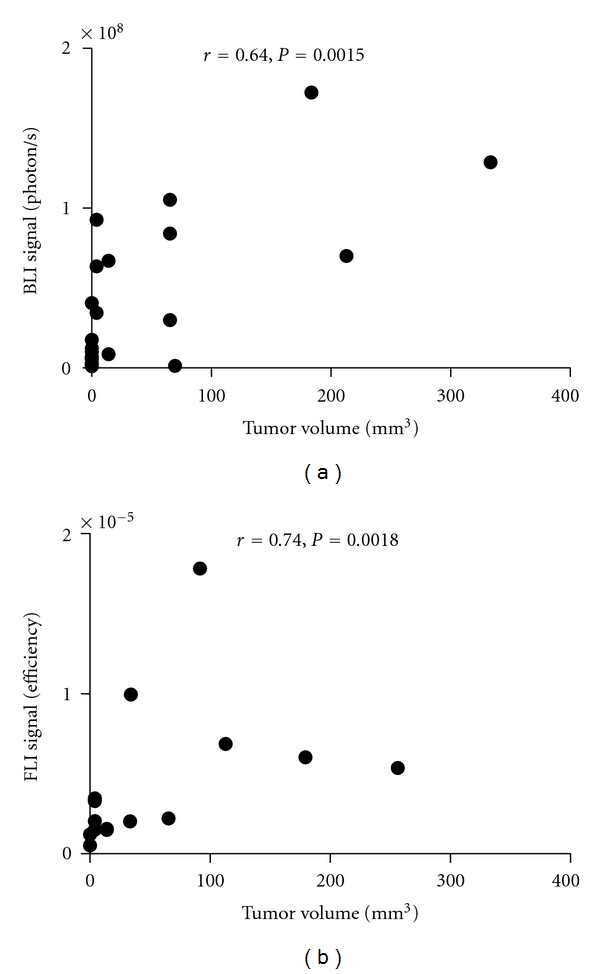
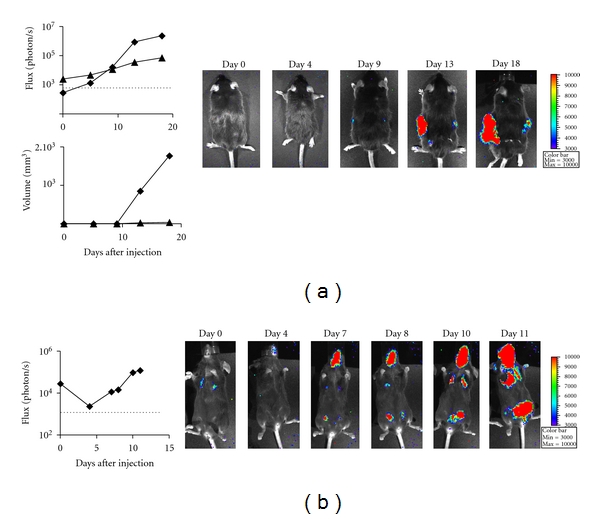
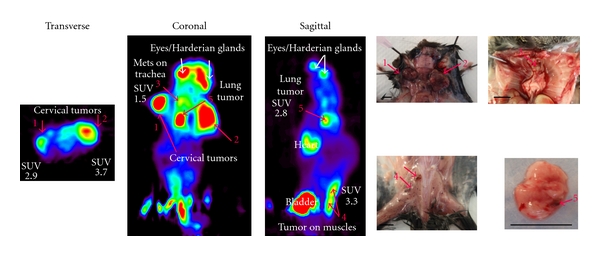
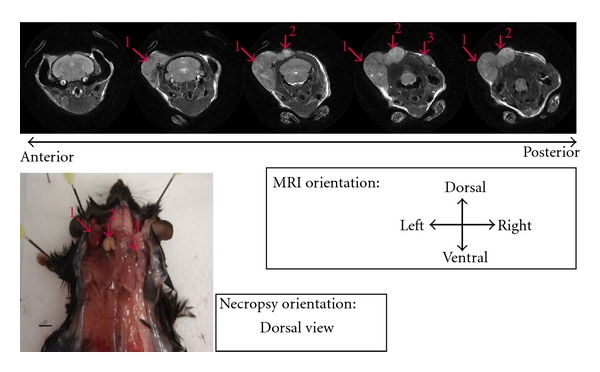
Introduction and Purpose. Monitoring solid tumor growth and metastasis in small animals is important for cancer research. Noninvasive techniques make longitudinal studies possible, require fewer animals, and have greater statistical power. Such techniques include FDG positron emission tomography (FDG-PET), magnetic resonance imaging (MRI), and optical imaging, comprising bioluminescence imaging (BLI) and fluorescence imaging (FLI). This study compared the performance and usability of these methods in the context of mouse tumor studies. Methods. B16 tumor-bearing mice (n = 4 for each study) were used to compare practicality, performance for small tumor detection and tumor burden measurement. Using RETAAD mice, which develop spontaneous melanomas, we examined the performance of MRI (n = 6 mice) and FDG-PET (n = 10 mice) for tumor identification. Results. Overall, BLI and FLI were the most practical techniques tested. Both BLI and FDG-PET identified small nonpalpable tumors, whereas MRI and FLI only detected macroscopic, clinically evident tumors. FDG-PET and MRI performed well in the identification of tumors in terms of specificity, sensitivity, and positive predictive value. Conclusion. Each of the four methods has different strengths that must be understood before selecting them for use.
Figures

Similar articles
-
Fluorescence imaging of bombesin and transferrin receptor expression is comparable to 18F-FDG PET in early detection of sorafenib-induced changes in tumor metabolism.PLoS One. 2017 Aug 8;12(8):e0182689. doi: 10.1371/journal.pone.0182689. eCollection 2017. PLoS One. 2017. PMID: 28792505 Free PMC article.
-
More advantages in detecting bone and soft tissue metastases from prostate cancer using 18F-PSMA PET/CT.Hell J Nucl Med. 2019 Jan-Apr;22(1):6-9. doi: 10.1967/s002449910952. Epub 2019 Mar 7. Hell J Nucl Med. 2019. PMID: 30843003
-
Noninvasive bioluminescence imaging of luciferase expressing intracranial U87 xenografts: correlation with magnetic resonance imaging determined tumor volume and longitudinal use in assessing tumor growth and antiangiogenic treatment effect.Neurosurgery. 2006 Feb;58(2):365-72; discussion 365-72. doi: 10.1227/01.NEU.0000195114.24819.4F. Neurosurgery. 2006. PMID: 16462491
-
Indirect comparison of the diagnostic performance of 18F-FDG PET/CT and MRI in differentiating benign and malignant ovarian or adnexal tumors: a systematic review and meta-analysis.BMC Cancer. 2021 Oct 6;21(1):1080. doi: 10.1186/s12885-021-08815-3. BMC Cancer. 2021. PMID: 34615498 Free PMC article.
-
18F-FDG PET/CT and whole-body MRI diagnostic performance in M staging for non-small cell lung cancer: a systematic review and meta-analysis.Eur Radiol. 2020 Jul;30(7):3641-3649. doi: 10.1007/s00330-020-06703-1. Epub 2020 Mar 3. Eur Radiol. 2020. PMID: 32125513
Cited by
-
Improved visualization of lung metastases at single cell resolution in mice by combined in-situ perfusion of lung tissue and X-Gal staining of lacZ-tagged tumor cells.J Vis Exp. 2012 Aug 21;(66):e4162. doi: 10.3791/4162. J Vis Exp. 2012. PMID: 22929213 Free PMC article.
-
Non-invasive sensitive brain tumor detection using dual-modality bioimaging nanoprobe.Nanotechnology. 2019 Jul 5;30(27):275101. doi: 10.1088/1361-6528/ab0e9c. Epub 2019 Mar 11. Nanotechnology. 2019. PMID: 30856613 Free PMC article.
-
The HGF/SF Mouse Model of UV-Induced Melanoma as an In Vivo Sensor for Metastasis-Regulating Gene.Int J Mol Sci. 2017 Jul 28;18(8):1647. doi: 10.3390/ijms18081647. Int J Mol Sci. 2017. PMID: 28788083 Free PMC article. Review.
-
Vascular patterning of subcutaneous mouse fibrosarcomas expressing individual VEGF isoforms can be differentiated using angiographic optical coherence tomography.Biomed Opt Express. 2017 Sep 19;8(10):4551-4567. doi: 10.1364/BOE.8.004551. eCollection 2017 Oct 1. Biomed Opt Express. 2017. PMID: 29082084 Free PMC article.
-
Non-Invasive Imaging and Scoring of Peritoneal Metastases in Small Preclinical Animal Models Using Ultrasound: A Preliminary Trial.Biomedicines. 2022 Jul 6;10(7):1610. doi: 10.3390/biomedicines10071610. Biomedicines. 2022. PMID: 35884917 Free PMC article.
References
-
- Gajewski TF, Markiewicz MA, Uyttenhove C. The p815 mastocytoma tumor model. Current Protocols in Immunology. 2001;(chapter 20) - PubMed
-
- Lengagne R, Graff-Dubois S, Garcette M, et al. Distinct role for CD8 T cells toward cutaneous tumors and visceral metastases. Journal of Immunology. 2008;180(1):130–137. - PubMed
-
- Lin EY, Li JF, Gnatovskiy L, et al. Macrophages regulate the angiogenic switch in a mouse model of breast cancer. Cancer Research. 2006;66(23):11238–11246. - PubMed
-
- Bidard FC, Vincent-Salomon A, Gomme S, et al. Disseminated tumor cells of breast cancer patients: a strong prognostic factor for distant and local relapse. Clinical Cancer Research. 2008;14(11):3306–3311. - PubMed
LinkOut - more resources
Full Text Sources
