. 2012 Jan 17;84(2):1003-11.
doi: 10.1021/ac202578x. Epub 2011 Dec 21.

Evaluation of a droplet digital polymerase chain reaction format for DNA copy number quantification

Affiliations

Evaluation of a droplet digital polymerase chain reaction format for DNA copy number quantification

Leonardo B Pinheiro et al. Anal Chem. .

Abstract

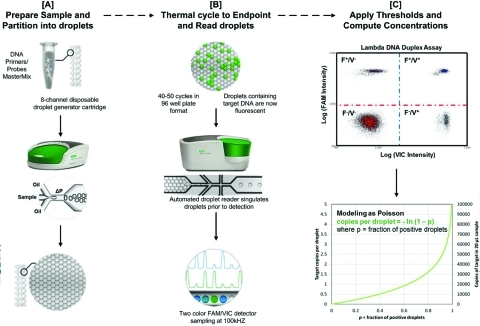
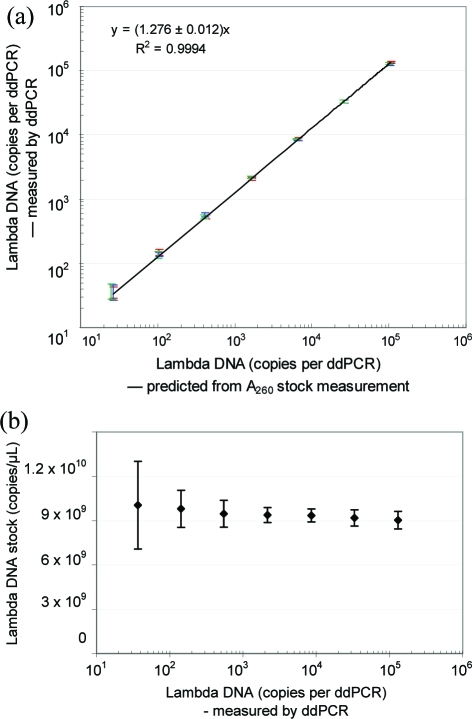
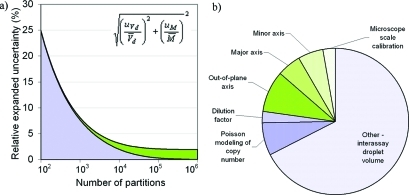
Droplet digital polymerase chain reaction (ddPCR) is a new technology that was recently commercialized to enable the precise quantification of target nucleic acids in a sample. ddPCR measures absolute quantities by counting nucleic acid molecules encapsulated in discrete, volumetrically defined, water-in-oil droplet partitions. This novel ddPCR format offers a simple workflow capable of generating highly stable partitioning of DNA molecules. In this study, we assessed key performance parameters of the ddPCR system. A linear ddPCR response to DNA concentration was obtained from 0.16% through to 99.6% saturation in a 20,000 droplet assay corresponding to more than 4 orders of magnitude of target DNA copy number per ddPCR. Analysis of simplex and duplex assays targeting two distinct loci in the Lambda DNA genome using the ddPCR platform agreed, within their expanded uncertainties, with values obtained using a lower density microfluidic chamber based digital PCR (cdPCR). A relative expanded uncertainty under 5% was achieved for copy number concentration using ddPCR. This level of uncertainty is much lower than values typically observed for quantification of specific DNA target sequences using currently commercially available real-time and digital cdPCR technologies.


Figures

Figure 1
Figure 1
Schematic showing the ddPCR workflow. (A) Each 20 μL sample containing the Master Mix, primers, TaqMan probes, and DNA target is loaded in the middle wells of a disposable eight channel droplet generator cartridge (pictured). Droplet generation oil (8 × 60 μL) containing the emulsion stabilizing surfactant is then loaded into the left-hand wells of the droplet generator cartridge. A vacuum is automatically applied to the outlet well (right) creating a pressure difference that, together with the geometry of the microfluidic circuit, converts the aqueous sample into stable, monodisperse, water-in-oil droplet emulsions which concentrate due to density differences from the oil phase and accumulate in the droplet collection wells of the cartridge. The droplets from each well are then transferred to one well of a 96-well plate, foil sealed, and thermal-cycled to the end-point. (B) After amplification, the plate is then loaded to a droplet reader where an autosampler aspirates the droplets and, using a microfluidic singulator, streams them single file (∼1500 droplets/s) past a FAM/VIC two color fluorescence detector which samples at a rate of 100 kHz. (C) The difference in fluorescence amplitudes for droplets where amplification has or has not occurred (positive and negatives, respectively) divides the entire droplet population into four discrete clusters for a typical Fam/Vic duplex assay. These four populations are droplets containing either no target (F–/V−), one of the targets (F–/V+, F+,V−), or both targets (F+,V+). Setting a fluorescence threshold for each detection channel affords a digital method of droplet classification and computing the average number of copies per droplet based on the fraction of positive droplets and Poisson modeling.
Figure 2
Figure 2
Schematic diagram of experimental design for assessing linearity and precision.
Figure 3
Figure 3
(a) Linearity and (b) precision across the dynamic range of ddPCR. (a) Red, green, and blue error bars denote the standard deviation of the Lambda DNA copy number per 20 μL of ddPCR for each of three independent gravimetric dilutions (estimated from n = 7 or 8 replicates in each case). The 95% confidence interval of the slope of the combined data is as indicated in the equation. (b) Each symbol denotes the stock Lambda DNA concentration (copies/μL) (estimated from n = 7 or 8 replicates for each of three independent gravimetric dilutions). Error bars represent the expanded uncertainty calculated by multiplying the combined standard uncertainty (eq 8) with a coverage factor of between 2.05 and 2.09 depending on the number of replicates in the independent gravimetric dilutions. This provides a level of confidence of 95% in the expanded uncertainty.
Figure 4
Figure 4
Factors contributing to measurement uncertainty. (a) Theoretical relative expanded uncertainty of concentration considering only two factors: Type B partition volume component, Vd with a relative uncertainty of 1.0% (green), and uncertainty of the Poisson modeling of copy number per droplet, M, (mesh blue) calculated for the condition when 80% of the reactions are positive following digital PCR. This is close to the optimal percentage of positive reactions for minimizing the uncertainty of the copy number estimate, regardless of the number of reactions in the assay. The relative standard uncertainties of these two factors were combined (inset) and then multiplied by two to obtain the relative expanded uncertainty with a level of confidence of 95%. (b) Contributions to concentration uncertainty for a ddPCR data set comprising five replicate analyses from each of three independent gravimetric dilutions analyzed using assay 2 under simplex conditions (see Table 1 for details). This data set had a relative expanded uncertainty of only 4.2%, which was determined by multiplying the combined standard uncertainty (eq 8) by a coverage factor of 2.09 to provide a level of confidence of 95%. The contributions of the components of droplet volume (Type B components only) are indicated in green shading and the components of precision are indicated in blue shading. In this data set, a total of 190 433 droplets were accepted by the droplet reader and 19.1% of these droplets were positive.

References

    1. Sykes P. J.; Neoh S. H.; Brisco M. J.; Hughes E.; Condon J.; Morley A. A. Biotechniques 1992, 13, 444–449. - PubMed
    1. Vogelstein B.; Kinzler K. W. Proc. Natl. Acad. Sci. U.S.A. 1999, 96, 9236–9241. - PMC - PubMed
    1. Sanders R.; Huggett J. F.; Bushell C. A.; Cowen S.; Scott D. J.; Foy C. A. Anal. Chem. 2011, 83, 6474–6484. - PubMed
    1. Lo Y. M.; Lun F. M.; Chan K. C.; Tsui N. B.; Chong K. C.; Lau T. K.; Leung T. Y.; Zee B. C.; Cantor C. R.; Chiu R. W. Proc. Natl. Acad. Sci. U.S.A. 2007, 104, 13116–13121. - PMC - PubMed
    1. Wang J.; Ramakrishnan R.; Tang Z.; Fan W.; Kluge A.; Dowlati A.; Jones R. C.; Ma P. C. Clin. Chem. 2010, 56, 623–632. - PubMed

Publication types