. 2011;13(6):R121.
doi: 10.1186/bcr3067. Epub 2011 Nov 28.

Different mechanisms for resistance to trastuzumab versus lapatinib in HER2-positive breast cancers--role of estrogen receptor and HER2 reactivation

Affiliations

Different mechanisms for resistance to trastuzumab versus lapatinib in HER2-positive breast cancers--role of estrogen receptor and HER2 reactivation

Yen-Chao Wang et al. Breast Cancer Res. 2011.

Abstract

Introduction: The human epidermal growth factor receptor 2 (HER2)-targeted therapies trastuzumab (T) and lapatinib (L) show high efficacy in patients with HER2-positive breast cancer, but resistance is prevalent. Here we investigate resistance mechanisms to each drug alone, or to their combination using a large panel of HER2-positive cell lines made resistant to these drugs.

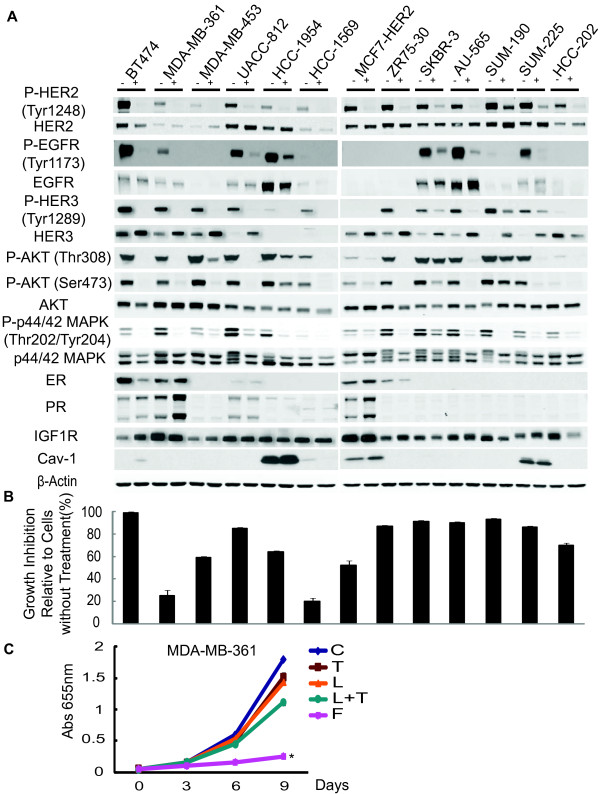
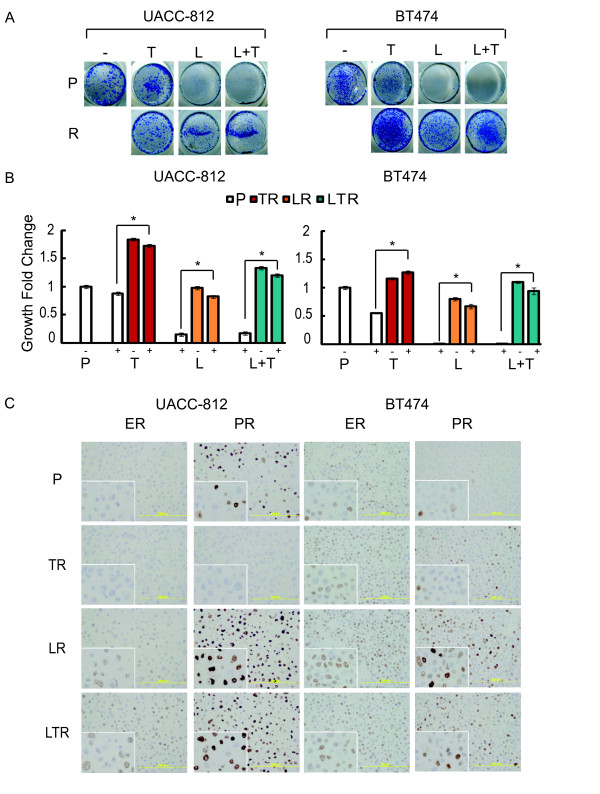
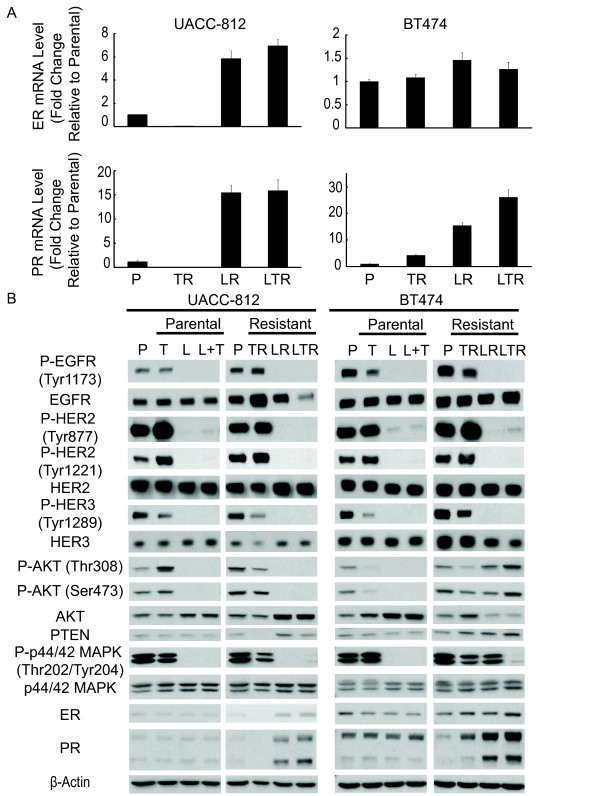
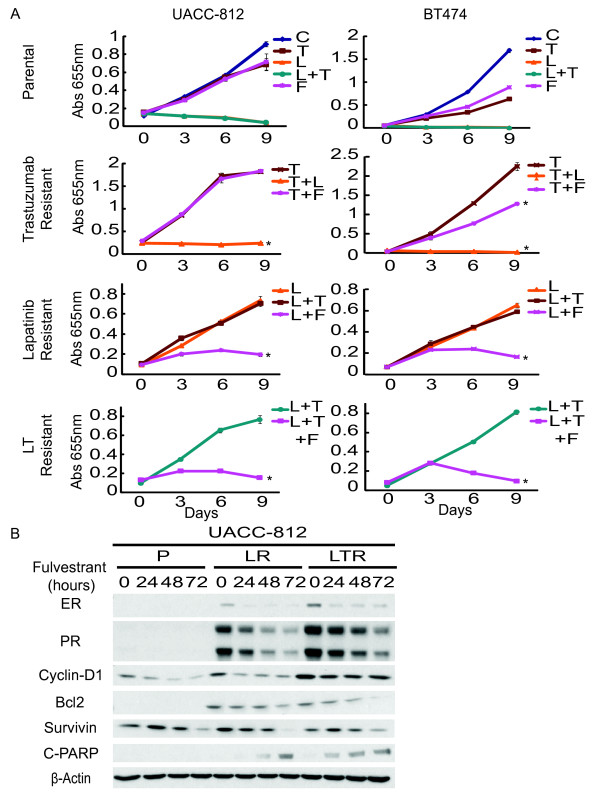
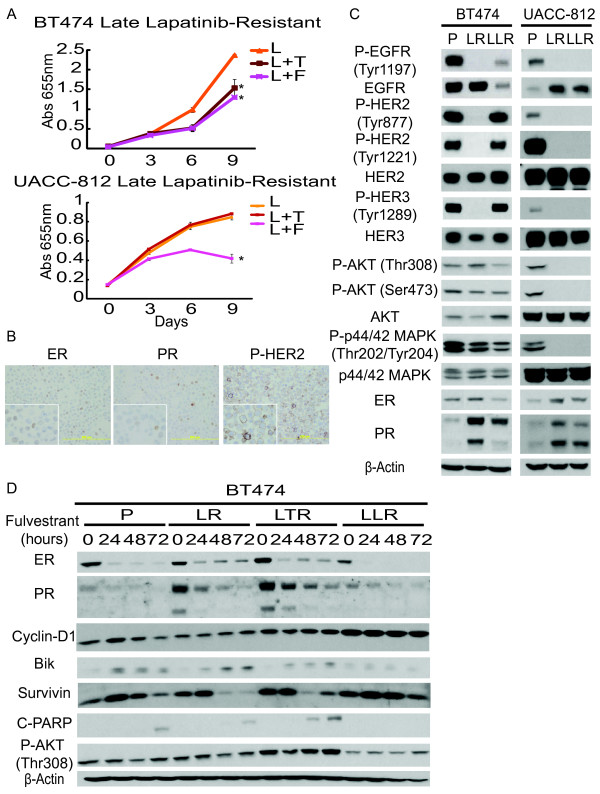
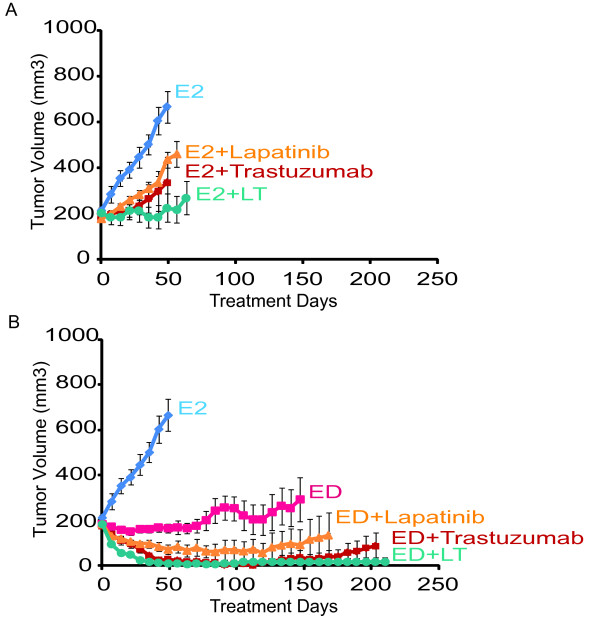
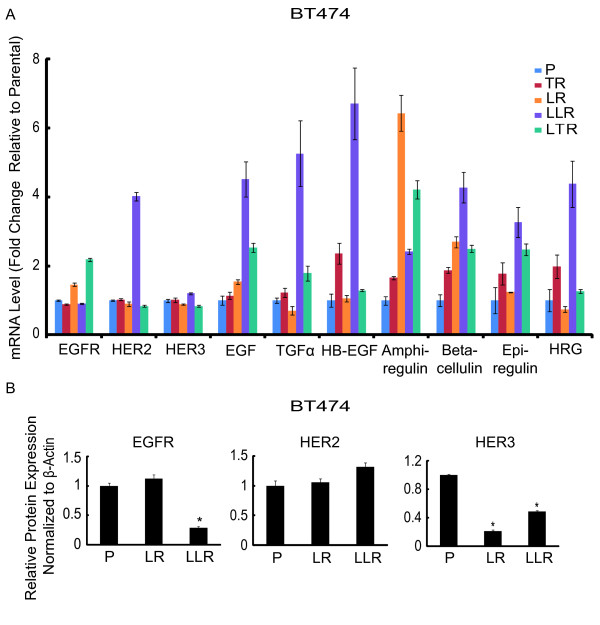
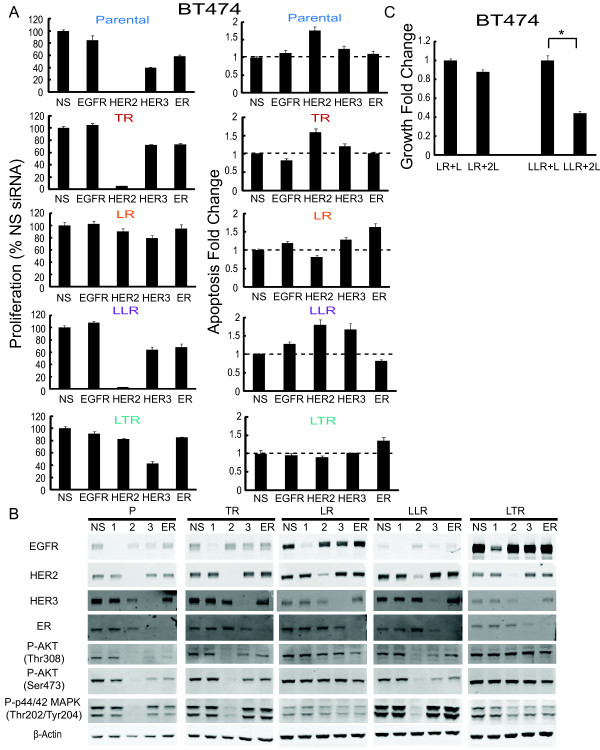
Methods: Response to L + T treatment was characterized in a panel of 13 HER2-positive cell lines to identify lines that were de novo resistant. Acquired resistant lines were then established by long-term exposure to increasing drug concentrations. Levels and activity of HER2 and estrogen receptor (ER) pathways were determined by qRT-PCR, immunohistochemistry, and immunoblotting assays. Cell growth, proliferation, and apoptosis in parental cells and resistant derivatives were assessed in response to inhibition of HER or ER pathways, either pharmacologically (L, T, L + T, or fulvestrant) or by using siRNAs. Efficacy of combined endocrine and anti-HER2 therapies was studied in vivo using UACC-812 xenografts.

Results: ER or its downstream products increased in four out of the five ER+/HER2+ lines, and was evident in one of the two intrinsically resistant lines. In UACC-812 and BT474 parental and resistant derivatives, HER2 inhibition by T reactivated HER network activity to promote resistance. T-resistant lines remained sensitive to HER2 inhibition by either L or HER2 siRNA. With more complete HER2 blockade, resistance to L-containing regimens required the activation of a redundant survival pathway, ER, which was up-regulated and promoted survival via various Bcl2 family members. These L- and L + T-resistant lines were responsive to fulvestrant and to ER siRNA. However, after prolonged treatment with L, but not L + T, BT474 cells switched from depending on ER as a survival pathway, to relying again on the HER network (increased HER2, HER3, and receptor ligands) to overcome L's effects. The combination of endocrine and L + T HER2-targeted therapies achieved complete tumor regression and prevented development of resistance in UACC-812 xenografts.

Conclusions: Combined L + T treatment provides a more complete and stable inhibition of the HER network. With sustained HER2 inhibition, ER functions as a key escape/survival pathway in ER-positive/HER2-positive cells. Complete blockade of the HER network, together with ER inhibition, may provide optimal therapy in selected patients.


Figures

Figure 1
Figure 1
HER2-overexpressing cell lines exhibit distinct responses when treated with potent anti-HER2 therapy. (A) A panel of HER2-overexpressing breast cancer cell lines was treated with lapatinib (1 μM) plus trastuzumab (10 μg/ml) for 48 h and whole-cell extracts were analyzed by immunoblotting with indicated antibodies. (B) Combination therapy (trastuzumab plus lapatinib) growth response in the HER2-overexpressing breast cancer cell line panel. Growth inhibition was determined by methylene blue assay. Shown are the percent inhibitions of cells treated for six days normalized to non-treated cells. The experiment was performed in quadruplicate. Error bars on plots represent +/- standard error (SE). (C) Growth curves of de novo resistant MDA-MB-361 cells treated with different target therapies/regimens for nine days: trastuzumab (T) (10 μg/ml), lapatinib (L) (1 μM), trastuzumab plus lapatinib (L + T), or endocrine therapy, fulvestrant (F) (10-7 M), untreated (C). Cell numbers were quantified by absorbance at 655 nm after staining with methylene blue. Conditions were repeated in quadruplicate. Significance between groups was determined by multiple comparisons using the Sidak method (*P < 0.0001, F versus C, T, L, or L + T).
Figure 2
Figure 2
Resistant cells show greater proliferation and exhibit changes in ER and PR expression. (A) Cell proliferation assay of UACC-812 and BT474 parental and resistant (R) cells. Cells were treated with trastuzumab (T, 10 μg/ml), lapatinib (L, 1 μM), or trastuzumab plus lapatinib (L + T). After six days, viable cells were visualized by methylene blue staining and photographed. (B) Fold changes in cell growth of UACC-812 and BT474 parental and resistant cells with or without the respective anti-HER2 therapies, following six days of treatment. Cell numbers were quantified by absorbance at 655 nm and normalized against Day 0. Significance between groups was determined by multiple comparisons using the Sidak method (*P < 0.0001, P:T versus TR:T, P:L versus LR:L, or P:L + T versus LTR:L + T for both models). (C) Immunohistochemical detection of ER and PR in BT474 and UACC-812 parental and distinct resistant clones.
Figure 3
Figure 3
Trastuzumab resistant cells maintain HER signaling. Lapatinib and combination resistant cells express up-regulated ER activity. (A) qRT-PCR expression levels of ER and PR mRNA in UACC-812 and BT474 parental and distinct resistant clones. Data were normalized to parental cells. (B) UACC-812 and BT474 parental cells were treated with trastuzumab (10 μg/ml), lapatinib (1 μM), or trastuzumab plus lapatinib for five hours and harvested. Whole-cell extracts of these treatment groups and resistant derivatives were analyzed by Western blot with the indicated antibodies.
Figure 4
Figure 4
Trastuzumab resistant cells remain sensitive to lapatinib. Fulvestrant inhibits lapatinib and combination resistant cell growth. (A) Growth curves of UACC-812 and BT474 parental and resistant cells treated with different target therapies/regimens for nine days: trastuzumab (T) (10 μg/ml), lapatinib (L) (1 μM), trastuzumab plus lapatinib (L + T), or endocrine therapy, fulvestrant (F) (10-7M); media of parental cells (C). Cell numbers were quantified by absorbance at 655 nm after staining with methylene blue. Conditions were repeated in quadruplicate. Significance between groups was determined by multiple comparisons using the Sidak method (*P < 0.0001, UACC-812 TR:T versus TR:T + L, LR:L versus LR:L + F, or LTR:L + T versus LTR:L + T + F; BT474 TR:T versus TR:T + L, TR:T versus TR:T + F, LR:L versus LR:L + F, or LTR:L + T versus LTR:L + T + F). (B) UACC-812 parental, lapatinib resistant, and combination resistant cells were treated with fulvestrant for 24, 48, 72 h and whole-cell extracts were analyzed by Western blot with the indicated antibodies.
Figure 5
Figure 5
BT474 lapatinib resistant cells with prolonged treatment reactivate HER receptor activity. (A) Growth curves of UACC-812 and BT474 late stage lapatinib resistant cells (LLR) treated with different targeted therapies for nine days: trastuzumab (T) (10 μg/ml), lapatinib (L) (1 μM), trastuzumab plus lapatinib, or endocrine therapy, fulvestrant (F) (10-7M). Significance between groups was determined by multiple comparisons using the Sidak method (*P = 0.0008, BT474 LLR + L versus LLR + L + F, *P = 0.0044, BT474 LLR + L versus LLR + L + T; *P < 0.0001, UACC-812 LLR + L versus LLR + L + F). (B) Immunohistochemical detection of ER, PR, and phospho-HER2 (Tyr877) in BT474 late stage lapatinib resistant cells. (C) Western blot analysis of UACC-812 and BT474 parental and resistant cell lines, including early (LR) and late (LLR) stage lapatinib resistant cells. Whole-cell extracts were analyzed by Western blot with the indicated antibodies. (D) BT474 parental, early, late stage lapatinib resistant, and combination (L + T) resistant cells were treated with fulvestrant for 24, 48, or 72 h and whole-cell extracts were analyzed by Western blot with the indicated antibodies.
Figure 6
Figure 6
Growth of UACC-812 xenografts treated with various anti-HER2 treatments, with or without estrogen deprivation. (A) Treatment in the presence of estrogen supplementation, representing no endocrine therapy. Treatments included: Estrogen alone (E2) or with lapatinib (E2 + L), trastuzumab (E2 + T), or their combination (E2 + L + T). (B) Treatments in the presence of endocrine therapy in the form of estrogen deprivation. Treatments included: Estrogen (E2), estrogen deprivation (ED) alone, or along with lapatinib (ED + L), trastuzumab (ED + T), or their combination (ED + L + T). Results are presented as the mean tumor volume; error bars represent the standard error.
Figure 7
Figure 7
BT474 late stage lapatinib-resistant cells overexpress HER2 and HER ligands. (A) mRNA expression levels of HER receptors and ligands in BT474 parental and distinct resistant derivatives by qRT-PCR. Data were normalized to parental cells. (B) EGFR, HER2, and HER3 protein levels in BT474 parental, early, and late stage lapatinib-resistant cells. Protein level was quantified with Odyssey software (LI-COR Biosciences, Inc., Lincoln, NE). Each expression level was acquired from three independent samples for each derivative. Significance between groups was determined by multiple comparisons using the Sidak method (*P < 0.0001, EGFR expression: P versus LLR; HER3 expression: P versus LR, P versus LLR, or LR versus LLR).
Figure 8
Figure 8
Inhibition of HER2 restores lapatinib sensitivity in BT474 late stage lapatinib resistant cells. (A) BT474 parental and resistant cells were treated with pooled EGFR, HER2, HER3, ER siRNA, or non-targeting control siRNA, for 72 hours. Proliferation was measured using the Click-iT EdU (5-ethynyl-2'- deoxyuridine) Microplate Assay. Apoptosis was measured by detecting Annexin V expression. Signals were visualized and quantitated by the Celigo cytometer (Cyntellect, San Diego, CA, USA). (B) Down-regulation of EGFR, HER2, HER3, and ER in BT474 derivatives after siRNA treatment was detected by Western blot. Whole-cell extracts were analyzed with the indicated antibodies, including downstream signaling. (C) Growth fold change of double dosage (2 μM) lapatinib on BT474 early and late stage-lapatinib resistant cells for six-day treatment. Cell numbers were assessed using methylene blue and quantified by absorbance at 655 nm and normalized against Day 0. Significance between groups was determined by multiple comparisons using the Sidak method (*P < 0.0001, LLR + L versus LLR + 2L).

Similar articles

Cited by

References

    1. Bublil EM, Yarden Y. The EGF receptor family: spearheading a merger of signaling and therapeutics. Curr Opin Cell Biol. 2007;19:124–134. doi: 10.1016/j.ceb.2007.02.008. - DOI - PubMed
    1. Citri A, Yarden Y. EGF-ERBB signalling: towards the systems level. Nat Rev Mol Cell Biol. 2006;7:505–516. doi: 10.1038/nrm1962. - DOI - PubMed
    1. Yarden Y, Sliwkowski MX. Untangling the ErbB signalling network. Nat Rev Mol Cell Biol. 2001;2:127–137. doi: 10.1038/35052073. - DOI - PubMed
    1. Slamon DJ, Clark GM, Wong SG, Levin WJ, Ullrich A, McGuire WL. Human breast cancer: correlation of relapse and survival with amplification of the HER-2/neu oncogene. Science. 1987;235:177–182. doi: 10.1126/science.3798106. - DOI - PubMed
    1. Geyer CE, Forster J, Lindquist D, Chan S, Romieu CG, Pienkowski T, Jagiello-Gruszfeld A, Crown J, Chan A, Kaufman B, Skarlos D, Campone M, Davidson N, Berger M, Oliva C, Rubin SD, Stein S, Cameron D. Lapatinib plus capecitabine for HER2-positive advanced breast cancer. N Engl J Med. 2006;355:2733–2743. doi: 10.1056/NEJMoa064320. - DOI - PubMed

Publication types

MeSH terms