. 2012 Mar;40(6):2432-44.
doi: 10.1093/nar/gkr1121. Epub 2011 Nov 28.

A pre-initiation complex at the 3'-end of genes drives antisense transcription independent of divergent sense transcription

Affiliations

A pre-initiation complex at the 3'-end of genes drives antisense transcription independent of divergent sense transcription

Struan C Murray et al. Nucleic Acids Res. 2012 Mar.

Abstract

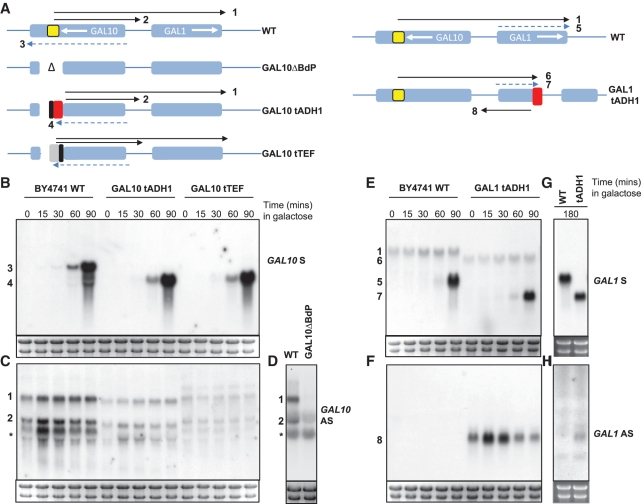
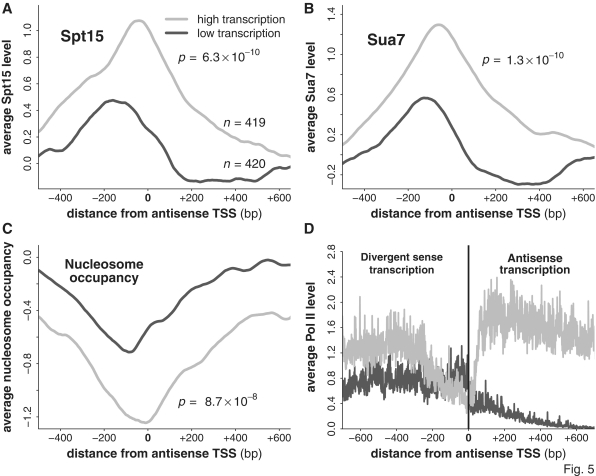
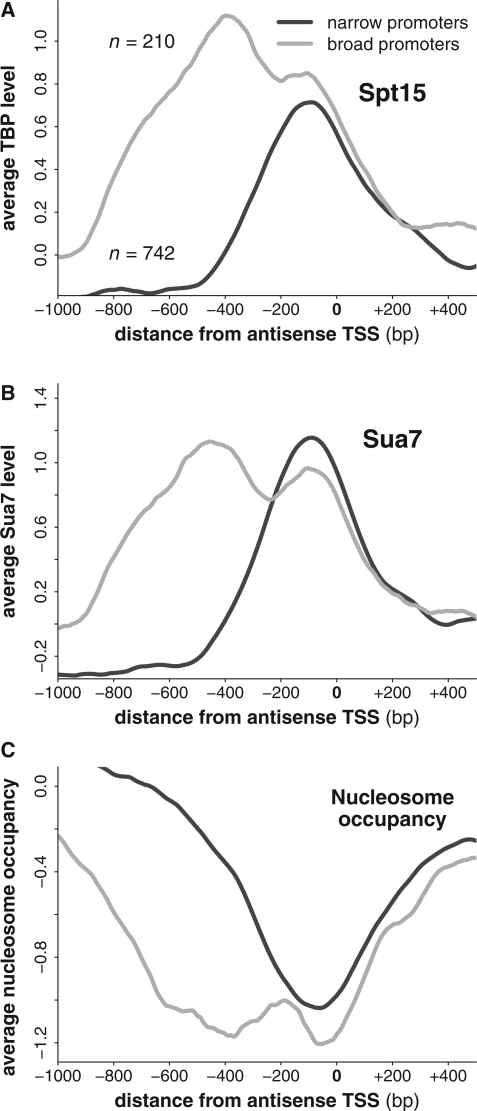
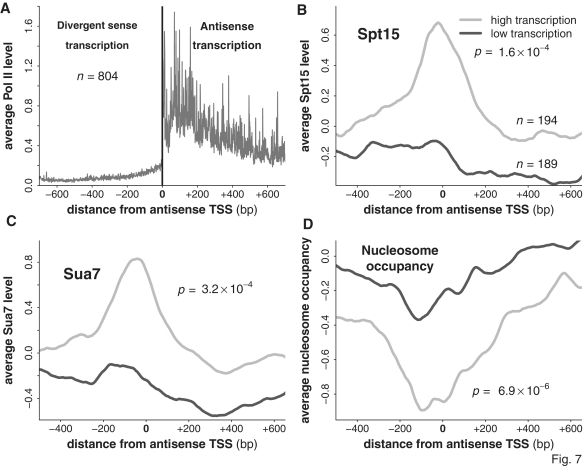
The precise nature of antisense transcripts in eukaryotes such as Saccharomyces cerevisiae remains elusive. Here we show that the 3' regions of genes possess a promoter architecture, including a pre-initiation complex (PIC), which mirrors that at the 5' region and which is much more pronounced at genes with a defined antisense transcript. Remarkably, for genes with an antisense transcript, average levels of PIC components at the 3' region are ∼60% of those at the 5' region. Moreover, at these genes, average levels of nascent antisense transcription are ∼45% of sense transcription. We find that this 3' promoter architecture persists for highly transcribed antisense transcripts where there are only low levels of transcription in the divergent sense direction, suggesting that the 3' regions of genes can drive antisense transcription independent of divergent sense transcription. To validate this, we insert short 3' regions into the middle of other genes and find that they are capable of both initiating antisense transcripts and terminating sense transcripts. Our results suggest that antisense transcription can be regulated independently of divergent sense transcription in a PIC-dependent manner and we propose that regulated production of antisense transcripts represents a fundamental and widespread component of gene regulation.


Figures

Figure 1.
Figure 1.
Evidence for PIC formation at the 3′ region of protein-coding genes. (A) The average levels of Spt15 and Sua7 at gene 5′ regions, obtained by aligning genes by their transcription start site (TSS). Nucleosome occupancy as determined by Fan et al. (2010) is included for comparative purposes, and is discussed in greater detail in the text. (B) The average levels of Spt15 and Sua7 at the 3′ regions of genes with antisense transcripts, obtained by aligning genes by their transcript termination site (TTS). (C and D) Spt15 and Sua7 levels at the 3′ regions of genes, comparing genes with antisense transcripts to those without. P-values were calculated using the Wilcoxon rank-sum test, comparing the distribution of values at the maximum point of each averaged curve. Note that these relationships remained when those genes whose TTSs were close to other genes were excluded from the analysis (see Supplementary Figure S2). (E) A comparison of the average transcription levels of the sense and antisense strands of protein-coding genes. The antisense strands of genes with antisense transcripts are considered separately from those without. Error bars were calculated by bootstrapping (the standard deviation of the mean of 1000 bootstrap pseudoreplicates). (F) Average levels of Pol II density across the antisense strands of protein-coding genes aligned by their 3′-ends. Shown is the average Pol II density of those genes possessing 3’ initiating antisense transcripts compared with those genes that do not.
Figure 2.
Figure 2.
Evidence that 3′ regions can function as both promoters of antisense transcription and as terminators of protein-coding sense transcripts. (A) Schematics showing the derivatives of GAL10 and GAL1. The direction of sense transcription is shown by the white arrows. (B–H) Autoradiographs of northern blots hybridized to strand-specific probes designed to detect the sense (S) or antisense (AS) transcripts at GAL10 (B–D) and GAL1 (E–H) in WT strains (BY4741), or after insertion of the ScADH1 3′ region (red box) into GAL10ΔBdP (A–C) and GAL1 (A and E–H) or the AgTEF 3′ region (grey box) into GAL10ΔBdP (A–C). The black box is the residual loxP sequences used in the construction. Total RNA was prepared from cells cultured in YPD or after induction in galactose for the time shown. GAL10 produces two major antisense transcripts (black arrows) in glucose medium, one extends over the GAL10-1 promoter (2) and the second longer transcript (1) extends sense to the end of GAL1 and persists for 90–100 min after induction but then is no longer detectable. There are other antisense transcripts (asterisks) that do not initiate at the BdP. Loss of the GAL10 internal promoter (yellow box) causes loss of both AS transcripts (GAL10ΔBdP; D) which can be restored by inserting either ScADH1 or AgTEF 3′ regions (C). The 18S and 25S rRNAs are used to estimate loading. For (B–F) exposure times and specific activities of probes are similar, although probe lengths are three times longer for GAL10 compared to GAL1 (see Supplementary Materials and Methods section). G is exposed four times shorter than B–F which reflects accumulation of GAL1 transcript to high levels. H is exposed 10 times longer than B–F to reveal very low levels of GAL1 AS in GAL1tADH1 3 h after induction.
Figure 3.
Figure 3.
3′ nucleosome occupancy determined using a MNase-dependent genome-wide assay (11). (A) The average occupancy at the 3′ region of those genes with antisense transcripts, compared to those without. (B) Comparison of the average A T richness at the 3′ region between those genes with antisense transcripts and those without. Note that the y-axis has been inverted for comparative purposes. All P-values were calculated using the Wilcoxon rank-sum test, comparing the distribution of values at the minimum point of each averaged curve.
Figure 4.
Figure 4.
3′ nucleosome occupancy determined using a MNase independent genome-wide assay (Fan et al. 2010). (A) The average occupancy at the 3′ region of those genes possessing antisense transcripts, compared with those genes that do not. P-values were calculated using the Wilcoxon rank-sum test and comparing the distribution of values at the minimum point of each averaged curve. (B) The transcription level of each protein-coding sense transcript plotted against the transcription level of its associated antisense transcript (if it has one). Shown is the Pearson correlation coefficient (−0.1). The Spearman correlation coefficient was −0.06.
Figure 5.
Figure 5.
Antisense initiation is supported by PIC formation upstream of the antisense TSS. (A–C) The average levels of Spt15, Sua7 and nucleosome occupancy around the TSS of both highly and lowly transcribed antisense transcripts. All P-values were calculated using the Wilcoxon rank-sum test, comparing the distribution of values at the maximum point of each averaged curve (the minimum point in the case of nucleosome occupancy). (D) The average level of nascent transcription around the TSS of the antisense transcripts. Shown left of the TSS is the average level of divergent sense transcription while on the right of the TSS is the average level of antisense transcription.
Figure 6.
Figure 6.
Bidirectional promoters show evidence of possessing two distinct PICs. (A–C) The average levels of Spt15, Sua7 and nucleosome occupancy around the TSS of antisense transcripts with an adjacent and divergent sense transcript. Shown are both the narrow and broad classes of bidirectional promoter.
Figure 7.
Figure 7.
PIC formation supports high levels of antisense transcription in the absence of high levels of divergent sense transcription. (A) We selected for a group of antisense transcripts with low levels of divergent sense transcription. Shown is the average level of nascent transcription around the TSS of antisense transcripts belonging to this group, with nascent sense transcription to the left of the TSS and nascent antisense transcription to the right. (B–D) The average levels of Spt15, Sua7 and nucleosome occupancy around the TSS of both highly and lowly transcribed antisense transcripts belonging to this group. All P-values were calculated using the Wilcoxon rank-sum test, comparing the distribution of values at the maximum point of each averaged curve (the minimum point in the case of nucleosome occupancy).

References

    1. Kapranov P, Willingham AT, Gingeras TR. Genome-wide transcription and the implications for genomic organization. Nat. Rev. Genet. 2007;8:413–423. - PubMed
    1. Berretta J, Morillon A. Pervasive transcription constitutes a new level of eukaryotic genome regulation. EMBO Rep. 2009;10:973–982. - PMC - PubMed
    1. Hongay CF, Grisafi PL, Galitski T, Fink GR. Antisense transcription controls cell fate in Saccharomyces cerevisiae. Cell. 2006;127:735–745. - PubMed
    1. Perocchi F, Xu Z, Clauder-Münster S, Steinmetz LM. Antisense artifacts in transcriptome microarray experiments are resolved by actinomycin D. Nucleic Acids Res. 2007;35:e128. - PMC - PubMed
    1. Camblong J, Iglesias N, Fickentscher F, Dieppois G, Stutz F. Antisense RNA stabilization induces transcriptional gene silencing via histone deacetylation in S. cerevisiae. Cell. 2007;131:706–717. - PubMed

Publication types

MeSH terms