. 2011 Nov 28;195(5):889-902.
doi: 10.1083/jcb.201104040.

Eisosome proteins assemble into a membrane scaffold

Affiliations

Eisosome proteins assemble into a membrane scaffold

Lena Karotki et al. J Cell Biol. .

Abstract

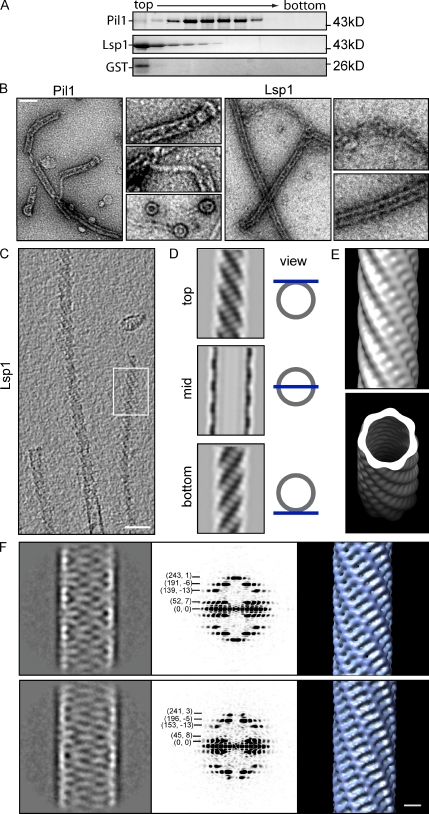
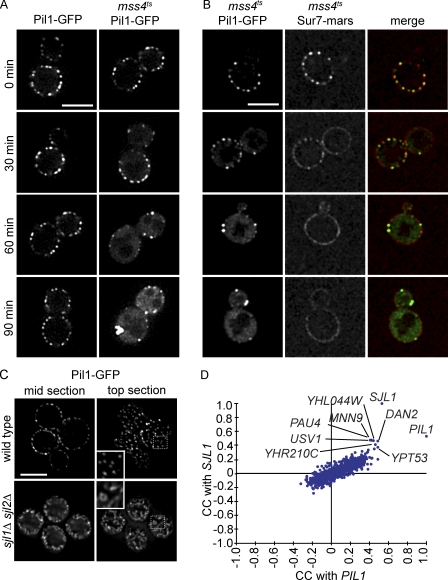
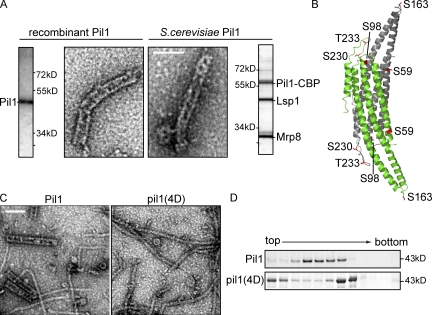
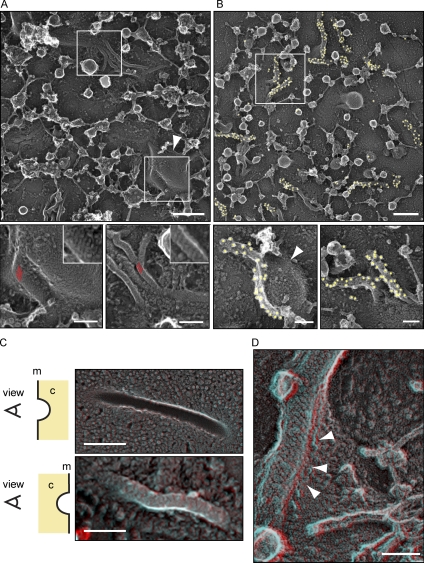
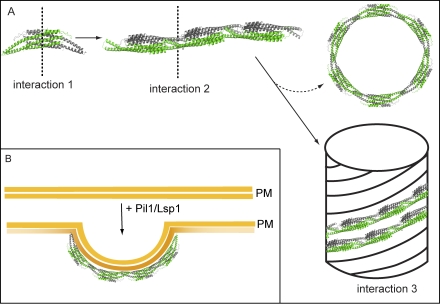
Spatial organization of membranes into domains of distinct protein and lipid composition is a fundamental feature of biological systems. The plasma membrane is organized in such domains to efficiently orchestrate the many reactions occurring there simultaneously. Despite the almost universal presence of membrane domains, mechanisms of their formation are often unclear. Yeast cells feature prominent plasma membrane domain organization, which is at least partially mediated by eisosomes. Eisosomes are large protein complexes that are primarily composed of many subunits of two Bin-Amphiphysin-Rvs domain-containing proteins, Pil1 and Lsp1. In this paper, we show that these proteins self-assemble into higher-order structures and bind preferentially to phosphoinositide-containing membranes. Using a combination of electron microscopy approaches, we generate structural models of Pil1 and Lsp1 assemblies, which resemble eisosomes in cells. Our data suggest that the mechanism of membrane organization by eisosomes is mediated by self-assembly of its core components into a membrane-bound protein scaffold with lipid-binding specificity.


Figures

Figure 1.
Figure 1.
Pil1 and Lsp1 form filaments in vitro. (A) Pil1 and Lsp1 aggregate in vitro. SDS-PAGE of factions of a sedimentation velocity gradient analyzing recombinant Pil1 and Lsp1. Protein marker sizes are indicated on the right. (B) Recombinant Pil1 and Lsp1 form filaments visualized by negative staining and EM. Pil1 assembles into ringlike structures as well as thin and thick filaments. Lsp1 mostly forms thick filaments. Bar, 100 nm. (C) Cryo-EM and tomographic reconstructions of Lsp1 filaments have a distinct striation pattern. Bar, 50 nm. (D) Averaged tomographic top, mid, and bottom sections of a thick Lsp1 filament. (E) Surface rendering of the Lsp1 filament reconstruction. (F) Classification of Lsp1 segments reveal classes differing in diameter (left panels; the narrow class is shown on the top, whereas the wider class is shown on the bottom). Power spectra of both major classes are characteristic for filaments of helical symmetry (middle panels) and reveal differences in geometry, also visible in the resulting 3D maps (right panels). Bar, 10 nm.
Figure 2.
Figure 2.
Pil1 and Lsp1 directly bind PI(4,5)P2-containing membranes. (A) Pil1 and Lsp1 bind and tubulate PI(4,5)P2-containing liposomes. Negative staining and EM of recombinant Pil1 or Lsp1 incubated with liposomes containing PC/PS/PE (70%/15%/15%) or, in addition, 1.5% PI(4,5)P2. (B) Negative-stained samples of recombinant Pil1 or Lsp1 incubated with PC liposomes containing 1.5% PI or PI(4,5)P2. Insets show magnifications of Pil1 bound to liposomes. (A and B) Protein-covered membrane tubules are marked with yellow arrowheads. Bars, 100 nm. (C, top) Spin-down experiments of Lsp1 incubated with or without PC liposomes containing 1% PI or PI(4,5)P2 as indicated. Proteins bound to liposomes appear in the pellet (P). Lsp1 shows higher affinity to PI(4,5)P2 than to PI. S, supernatant. (bottom) Quantification of protein amounts in the pellet fractions from spin-down experiments represented in a box plot, consisting of the median (middle of the box), the upper and lower quartile (edges of the box), and whiskers at a 1.5–interquartile range distance from the upper and lower quartile. (D) Measurement of fluorescence from NBD-labeled pil1S45C (orange emission spectrum) alone as well as in the presence of PC/PS/PI liposomes (purple emission spectrum) or PC/PS/PI(4,5)P2 (green emission spectrum); the buffer control is shown in gray. n = 6.
Figure 3.
Figure 3.
PI(4,5)P2 is necessary for normal eisosomes in vivo, and PIL1 has a highly similar genetic profile to SJL1. (A) Fluorescence microscopy of Pil1-GFP in a yeast mutant strain containing a temperature-sensitive allele of MSS4 (mss4ts). Pil1-GFP loses its normal eisosome pattern but instead clusters to enlarged structures at the membrane after a 90-min (right column) temperature shift from 24 to 37°C. The control strain does not show this phenotype (left column). (B) Fluorescence microscopy of Sur7-mars and Pil1-GFP in mss4ts cells. After 30 min of temperature shift, Sur7-mars loses its localization to the MCC. After 60 min, it is evenly distributed in the plasma membrane. (C) Deletion of SJL1 and SJL2 results in increased Pil1-GFP assembly at the plasma membrane. Insets show magnified regions of cells in the boxed areas. Bars, 5 µm. (D) Comparison of correlation scores from an E-MAP focusing on lipid metabolism. SJL1, encoding the PI(4,5)P2 phosphatase, has the most similar genetic signature to PIL1, indicating similar gene function. CC, correlation of correlations.
Figure 4.
Figure 4.
Structure of membrane-bound Pil1 and Lsp1. (A) Structure of Lsp1 and Pil1 bound to PI(4,5)P2-containing liposomes. Tomographic midsections show that both proteins decorate liposomes and constrict them to a similar diameter. Bar, 50 nm. (B) Classification of Lsp1 filament segments in addition to membrane-bound Lsp1 and Pil1 reveals different diameters. N represents the number of segments used for the classification. (C) Helical reconstruction of prominent groups of Lsp1 filaments as well as membrane-bound Lsp1 and Pil1. Membrane-bound Lsp1 shows distinct density oriented toward the lipid bilayer. Bar, 10 nm.
Figure 5.
Figure 5.
Pil1 and Lsp1 membrane binding requires an N-terminal segment and a patch of positively charged amino acids on their BAR domain surface. (A) Computational rigid body fitting of the Lsp1 BAR domain dimer x-ray structure to cryo-EM density maps of Lsp1 tubules and Lsp1 bound to PC liposomes containing 1.5% PI(4,5)P2. The top view of tubules (top) shows Lsp1 BAR domain monomer chains colored blue to red from N terminus to C terminus. The side view of tubules (bottom) shows the Lsp1 helix colored blue to red from the bottom to the top. (B) A close-up of the side view and intersection of the tubules. Lsp1 BAR domain monomer chains are colored blue to red from the N terminus to the C terminus. Density that might be occupied by the flexible tips of the x-ray structure, adopting a slightly different conformation in the tubules than in the crystal, is indicated by green arrows. The density that could be filled by the C termini, which are missing in the x-ray structure, is indicated by red arrows. (C) Negative staining and EM of recombinant Pil1 or Lsp1 proteins incubated with PC liposomes containing either 1.5 or 3.5% PI(4,5)P2. Mutants with an N-terminal truncation (lsp1ΔN) or changes in the positively charged amino acid patch of the concave BAR domain surface of Pil1 or Lsp1 (lsp1KRE) retain the ability to bind and tubulate PI(4,5)P2-containing liposomes. Combination of both types of mutation (lsp1ΔNKRE) abolishes membrane binding. Protein-covered membrane tubules are marked with yellow arrowheads. Bar, 100 nm. (D) Spin-down experiments of Lsp1, lsp1KRE, lsp1ΔN, or lsp1ΔNKRE incubated with or without PC liposomes containing 0.1, 1, 1.5, or 3.5% PI(4,5)P2 as indicated. Panels showing different experimental conditions are separated by dotted lines for better visibility. P, pellet; S, supernatant. (E) Quantification of protein amounts in pellet fractions of experiments analogous to D. n = 3. Error bars represent SDs of three independent experiments.
Figure 6.
Figure 6.
Purified eisosome proteins from yeast structurally resemble recombinant Pil1 or Lsp1 protein assemblies. (A) Tandem affinity chromatography of tagged Pil1 enriches mainly Pil1, Lsp1, and Mrp8. Negative staining and EM reveal highly similar structures for purified eisosomes (right) as formed by recombinant Pil1 (left). Side panels show Coomassie blue–stained SDS-PAGE gels of the preparations used. (B) X-ray structure of dimeric Lsp1 BAR domain. Monomers are shown as a ribbon representation in green and gray. Residues that can be phosphorylated and that are represented in the structure of eisosome protein BAR domains are highlighted in red. (C) Purification of recombinant pil1(4D) and visualization by negative staining and EM show that pil1(4D) does not form thick helices but only long, thin filaments. Bars, 100 nm. (D) Precipitated fractions of sedimentation velocity gradients of recombinant Pil1 and pil1(4D) were analyzed by SDS-PAGE. They show different mobility of phosphorylation mutants compared with wild-type Pil1.
Figure 7.
Figure 7.
Eisosomes in situ structurally resemble Pil1 and Lsp1 assemblies. (A) Representative image of the yeast plasma membrane from the cytosolic side (top). Bar, 300 nm. (insets) Magnifications of distinct areas (marked by white boxes) of the membrane show striated areas (red parallel lines) that resemble the pattern of recombinant Pil1 and Lsp1 structures. Bars, 100 nm. (B) Immunolabeling of plasma membranes of cells expressing Pil1-GFP using anti-GFP antibodies. Yellow circles highlight 18-nm gold particles for better visibility. Bars, 100 nm. (A and B) The structures are visible on the flat membrane as well as on the side of large invaginations (arrowheads). (C) DEEM images showing views on the plasma membrane from different perspectives. (top) View from the outside of a cell onto the inner leaflet of the plasma membrane. (bottom) View from the cytoplasm (marked as c) onto the plasma membrane (marked as m; red/cyan 3D glasses are recommended for 3D view, as well as for D). Bars, 300 nm. (D) View from the cytoplasm onto an eisosome at the plasma membrane. Arrowheads indicate how the plasma membrane protrudes underneath the eisosome protein coat to form a groove instead of a closed tube. Bar, 100 nm.
Figure 8.
Figure 8.
Model for the assembly of eisosomes on the plasma membrane. (A) The assembly of eisosomes can be separated conceptually into three steps: interactions of the proteins to form dimers (interaction 1), association of dimers to form thin filaments (interaction 2), and assembly into helices (interaction 3). Rings observed for Pil1 are interpreted in this model as side products of the filament-to-helix assembly. (B) On the plasma membrane (PM), main eisosome components assemble into a scaffold similar to a half helix (see Discussion for details).

References

    1. Aguilar P.S., Fröhlich F., Rehman M., Shales M., Ulitsky I., Olivera-Couto A., Braberg H., Shamir R., Walter P., Mann M., et al. 2010. A plasma-membrane E-MAP reveals links of the eisosome with sphingolipid metabolism and endosomal trafficking. Nat. Struct. Mol. Biol. 17:901–908 10.1038/nsmb.1829 - DOI - PMC - PubMed
    1. Bai J., Hu Z., Dittman J.S., Pym E.C., Kaplan J.M. 2010. Endophilin functions as a membrane-bending molecule and is delivered to endocytic zones by exocytosis. Cell. 143:430–441 10.1016/j.cell.2010.09.024 - DOI - PMC - PubMed
    1. Berchtold D., Walther T.C. 2009. TORC2 plasma membrane localization is essential for cell viability and restricted to a distinct domain. Mol. Biol. Cell. 20:1565–1575 10.1091/mbc.E08-10-1001 - DOI - PMC - PubMed
    1. Brach T., Specht T., Kaksonen M. 2011. Reassessment of the role of plasma membrane domains in the regulation of vesicular traffic in yeast. J. Cell Sci. 124:328–337 10.1242/jcs.078519 - DOI - PubMed
    1. Chacón P., Wriggers W. 2002. Multi-resolution contour-based fitting of macromolecular structures. J. Mol. Biol. 317:375–384 10.1006/jmbi.2002.5438 - DOI - PubMed

Publication types

MeSH terms