. 2012 Nov;22(11):2587-601.
doi: 10.1093/cercor/bhr330. Epub 2011 Nov 28.

Robo4 regulates the radial migration of newborn neurons in developing neocortex

Affiliations

Robo4 regulates the radial migration of newborn neurons in developing neocortex

Wang Zheng et al. Cereb Cortex. 2012 Nov.

Abstract

During the morphogenesis of neocortex, newborn neurons undergo radial migration from the ventricular zone toward the surface of the cortical plate to form an "inside-out" lamina structure. The spatiotemporal signals that control this stereotyped radial migration remain elusive. Here, we report that a recently identified Robo family member Robo4 (Magic Roundabout), which was considered to be solely expressed in endothelial cells, is expressed in developing brain and regulates the radial migration of newborn neurons in neocortex. Downregulation of Robo4 expression in cortical newborn neurons by using in utero electroporation, with either specific siRNAs in wild-type rodents or with Cre recombinase in floxed-robo4 mutant mice, led to severe defects in the radial migration of newborn neurons with misorientation of these neurons. Moreover, newborn neurons transfected with Robo4 siRNAs exhibited significantly lower motility in a transwell migration assay (Boyden chamber) in the absence of Slit and significantly higher sensitivity to the repulsive effect of Slit in both transwell migration assay and growth cone collapse assay. Overall, our results showed an important role of Robo4 in the regulation of cortical radial migration through Slit-dependent and -independent mechanisms.


Figures
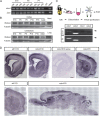
Figure 1.
Figure 1.
Robo4 is expressed in developing CNS. (A) Analysis of robo4 mRNA expression in rat CNS by RT-PCR. The mRNA from heart tissue was used as a positive control. Rat β-actin mRNA was also assayed as a loading control for RT-PCR. “−RT” refers to the PCR reaction performed in the absence of reverse transcriptase. Abbreviation: Ctx, cortex; Cb, cerebellum; Hip, hippocampus. (B) Western blotting analysis of Robo4 protein in the cortex and cerebellum. (C) Expression of robo mRNAs in newborn migrating neurons revealed by semiquantitative RT-PCR at different stages. Embryos were transfected by using IUE at E16. At E18 and P0, EYFP-labeled newborn neurons were dissociated and harvested by FACS. (D) ISH using robo4 and slit1 riboprobes. In coronal sections of neocortex, robo4 expression is located in VZ/SVZ and CP from E18 to P0. At P0, robo4 is expressed in the cortex, subcortical nuclei, hippocampus, midbrain, and cerebellum. Note the partial overlap of slit1 and robo4 signal in the somatosensory cortex during development. Scale bar, 500 μm. Abbreviation: OB, olfactory bulb; CC, corpus callosum; SN, striatal neuroepithelium; TH, thalamus; SC, superior colliculus; IC, inferior colliculus; St, striatum; Pir, piriform cortex.
Figure 2.
Figure 2.
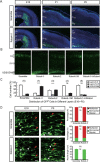
Retardation of cortical radial migration in rats by Robo4 downregulation. (A) Representative images of coronal sections of rat somatosensory cortex at different days after IUE of scramble or Robo4 siRNA constructs (E16–P5). Sections were immunostained for GFP (green) and counterstained with DAPI (blue). Scale bar, 250 μm. (B) Representative images of coronal sections of P5 rat somatosensory cortex transfected at E16 with different siRNA constructs using IUE including 2 effective siRNA sequences against robo4 (Robo4-i1 and -i2), a 3-point mutation sequence of Robo4-i1 (Robo4-i1M), and Robo4 siRNA mixed with human Robo4 homologue (Robo4-i1 + hRobo4, rescue). (C) Histograms showing the percentages of transfected cells at different regions of P5 rat cortex (mean ± standard error of the mean, ***P < 0.001). Numbers in brackets are numbers of brains analyzed in each group. Scale bar, 200 μm. (D) Knockdown of Robo4 did not affect the polarization of transfected cells. Representative images of transfected neurons in the SVZ and IZ of control or Robo4-i1-transfected cortical sections are shown in the left. Quantification of the proportion of monopolar/bipolar (red arrow) and multipolar (white arrow) GFP+ neurons and average length of leading neurites are shown in the histograms. Cells exhibiting more than 2 primary processes were counted as multipolar. For each condition, 4 sections (1 section per embryo) with at least 20 cells from each section were analyzed in parallel experiments (mean ± standard error of the mean). Scale bar, 20 μm.
Figure 3.
Figure 3.
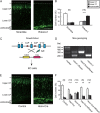
Retardation of cortical radial migration in mice by Robo4 downregulation. (A) Representative images of coronal sections of somatosensory cortices from E18.5 mice transfected at E14.5 with EYFP and different siRNA constructs using IUE (scramble siRNA, Robo4-i1). (B) Quantification of neurons in different layers (upper CP, lower CP, and VZ/SVZ/WM) of cortex at E18.5. Data are mean ± standard error of the mean (***P < 0.001). Numbers in brackets are numbers of brains analyzed in each group. Scale bar, 200 μm. (C) Schematics of robo4 knockout in mice. The third exon of robo4 gene was flanked by the loxp recombination sequence (see Materials and Methods). Knockout of robo4 in newborn neurons was carried out by IUE with Cre recombinase in floxed-robo4 mice at E14.5. (D) PCR analysis of genomic DNA from Robo4+/+, +/floxed, and floxed/floxed animals. The DNA band for WT allele is 212 and 314 bp for the floxed allele. (E) Representative images of coronal sections of E18.5 brains of floxed-robo4 mice IUE with control vector or Cre recombinase. Scale bar, 200 μm. (F) Quantification of neurons in different layers of cortex at E18.5 (mean ± standard error of the mean, ***P < 0.001).
Figure 4.
Figure 4.
Misorientation of leading processes of migrating neurons by Robo4 downregulation. (A) Representative images of migrating neurons from P0 cortices electroporated at E16 with control or Robo4-i1 siRNAs. The selected regions in the left panels are shown in high magnification at right (a,b; a,b) and the selected region in the right panel b (c) was shown in high magnification below in (B). The dash lines indicate the pial surface of brain slices and boundaries of different layers, and white arrows show neurons with reversed leading processes. Scale bar, 25 μm. (B) Schematic cartoon showing the measurement of the angle between the leading process and neighboring radial glial fiber. The selected regions (c) in (A,b’) are shown in high magnification as the paradigm. Arrow indicated the direction from cell body to the tips of leading process and minus angle indicated the leading process of the neuron was beneath neighboring radial glial fiber. (C) Polar plot showing the distributions of angles between the leading processes of transfected neurons and the neighboring radial glial fibers as indicated in (B). Cells located at the border between IZ and CP with bipolar migratory morphology were analyzed. The angles within ±15° were defined as “oriented normally” (green) (Hashimoto-Torii et al. 2008). Results are from at least 4 cortical sections in each group. (D) The percentages of normal orientated and abnormal orientated neurons in control and Robo4-i1-electroporated rat cortices (mean ± standard error of the mean, **P < 0.01). (E) The histogram showing the averaged absolute angles between leading progress and neighboring radial glial fiber in control and Robo4-i1-electroporated rat cortices (mean ± standard error of the mean, ***P < 0.001). (F) The cumulative percentage plot showing the distribution of the angle between the leading progress and the neighboring radial glial fiber in control and Robo4-i1-electroporated rat cortices described in (C) (***P < 0.001, Kolmogorov–Smirnov test).
Figure 5.
Figure 5.
GC collapse triggered by Slit upon Robo4 downregulation. (A) Schematic diagram of the GC collapse assay. Neurons transfected by IUE were dissociated from the IZ 2 days after IUE and cultured for 12–24 h. Before observation, hSlit2 conditional medium (hSlit2CM) or control medium (conditional medium from culture of 293 cell line, 293CM) was applied into the bath of neuronal culture. (B) Fluorescence images of fixed cortical neurons after 40 min treatment of Slit or control CM. Two typical control cells (transfected with scramble siRNA, upper) and Robo4-KD cells (transfected with Robo4-i1, below) with Slit2CM treatment are shown. Arrows indicate the collapsed GCs. (C) Line curves showing the percentages of neurons with noncollapsed GCs at the tip of the longest neurite in response to increasing concentrations of different CMs. Neurons were transfected with scramble or Robo4-i1 siRNA or hRobo4 as indicated in (A). Data are from at least 3 independent experiments (mean ± standard error of the mean, **P < 0.01, ***P < 0.001). (D) Time-lapse imaging of transfected neurons at various times (number in minute) before and after application of Slit2CM or 293CM. Cells were transfected and cultured as above. A control cell (transfected with scramble siRNA, left) and a Robo4-KD cell (transfected with Robo4-i1, left) incubated with Slit2CM are shown as examples. The dash lines indicate the centers of GCs at −10 min, and the arrow indicates the collapsing GC. Scale bar, 20 μm. Quantifications of normalized changes in neurite length and GC area after application of different CM are shown in the graphs at right. Numbers in brackets are numbers of cells analyzed in each group. Data from each time points (mean ± standard error of the mean) have been normalized to the value at start time (0 min) (**P < 0.01, ***P < 0.001).
Figure 6.
Figure 6.
Decrease of neuron motility and increase of Slit sensitivity upon Robo4 knockdown. (A) Representative images of newborn cortical neurons transfected with different constructs on the bottom side of the chamber. Two days after seeding, cells were fixed and immunostained with anti-GFP and anti-Tuj1 (not shown here) antibodies. Scale bar, 50 μm. (B) Histogram showing the average numbers of transfected neurons that had migrated to the bottom chamber in serum-free medium. Numbers of migrated neurons were normalized to the value of the parallel control. hRobo4 rescue, cotransfection of Robo4-i1 and hRobo4. (C) Histogram showing the average numbers of transfected neurons that had migrated to the bottom chamber in the absence or presence of Slit2 (6 μg ml−1) in the bottom chamber. (D) Histogram showing the significant higher percentage of reduction of transwell migration in response to Slit2 in Robo4-i1-transfected neurons compared with control neurons (scramble). Data are mean ± standard error of the mean, *P < 0.05, **P < 0.01, ***P < 0.001.

Similar articles

Cited by

References

    1. Amaral DG, Schumann CM, Nordahl CW. Neuroanatomy of autism. Trends Neurosci. 2008;31:137–145. - PubMed
    1. Andrews WD, Barber M, Parnavelas JG. Slit-Robo interactions during cortical development. J Anat. 2007;211:188–198. - PMC - PubMed
    1. Angevine JB, Jr, Sidman RL. Autoradiographic study of cell migration during histogenesis of cerebral cortex in the mouse. Nature. 1961;192:766–768. - PubMed
    1. Anitha A, Nakamura K, Yamada K, Suda S, Thanseem I, Tsujii M, Iwayama Y, Hattori E, Toyota T, Miyachi T, et al. Genetic analyses of roundabout (ROBO) axon guidance receptors in autism. Am J Med Genet B Neuropsychiatr Genet. 2008;147B:1019–1027. - PubMed
    1. Ayala R, Shu T, Tsai LH. Trekking across the brain: the journey of neuronal migration. Cell. 2007;128:29–43. - PubMed

Publication types

MeSH terms