. 2011 Dec 20;108(51):E1408-16.
doi: 10.1073/pnas.1115050108. Epub 2011 Nov 28.

Antitumor activity from antigen-specific CD8 T cells generated in vivo from genetically engineered human hematopoietic stem cells

Affiliations

Antitumor activity from antigen-specific CD8 T cells generated in vivo from genetically engineered human hematopoietic stem cells

Dimitrios N Vatakis et al. Proc Natl Acad Sci U S A. .

Abstract

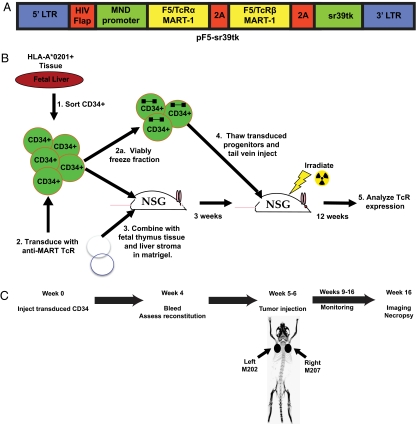
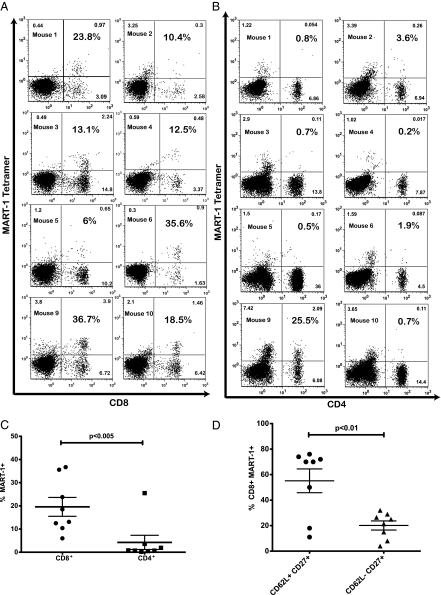
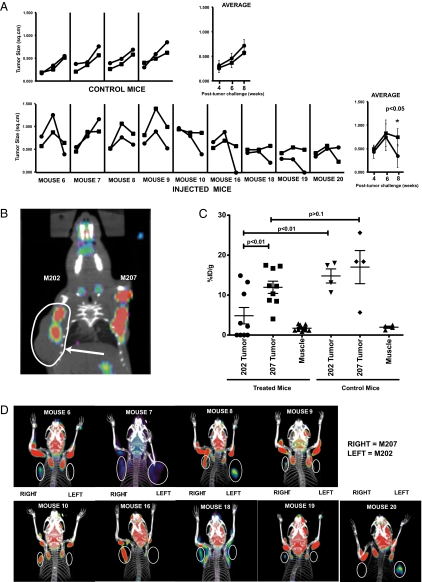
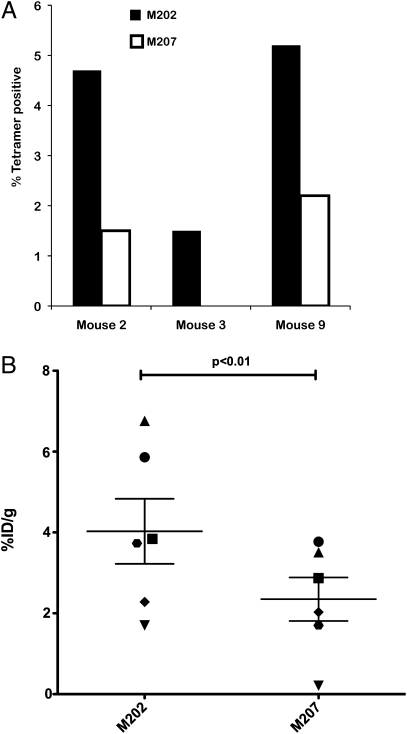
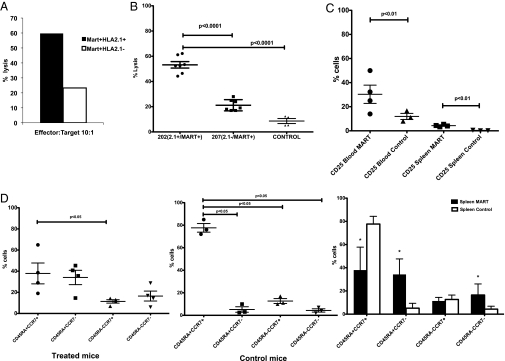
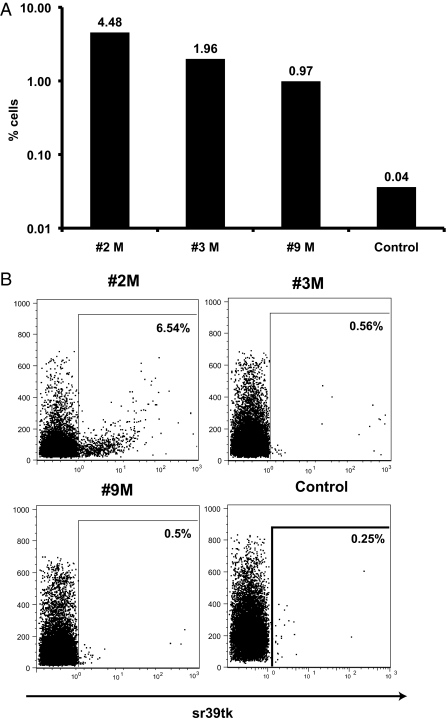
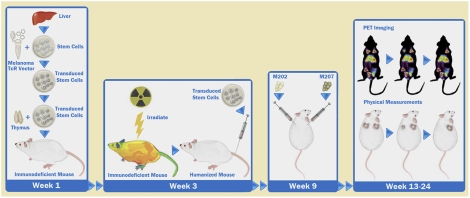
The goal of cancer immunotherapy is the generation of an effective, stable, and self-renewing antitumor T-cell population. One such approach involves the use of high-affinity cancer-specific T-cell receptors in gene-therapy protocols. Here, we present the generation of functional tumor-specific human T cells in vivo from genetically modified human hematopoietic stem cells (hHSC) using a human/mouse chimera model. Transduced hHSC expressing an HLA-A*0201-restricted melanoma-specific T-cell receptor were introduced into humanized mice, resulting in the generation of a sizeable melanoma-specific naïve CD8(+) T-cell population. Following tumor challenge, these transgenic CD8(+) T cells, in the absence of additional manipulation, limited and cleared human melanoma tumors in vivo. Furthermore, the genetically enhanced T cells underwent proper thymic selection, because we did not observe any responses against non-HLA-matched tumors, and no killing of any kind occurred in the absence of a human thymus. Finally, the transduced hHSC established long-term bone marrow engraftment. These studies present a potential therapeutic approach and an important tool to understand better and to optimize the human immune response to melanoma and, potentially, to other types of cancer.


Conflict of interest statement

The authors declare no conflict of interest.

Figures

Fig. 1.
Fig. 1.
The lentiviral vector and experimental mouse model used to generate MART-1–specific CTL. (A) A schematic diagram of the lentiviral vector used. The MART-1TCR chains and the sr39tk reporter are joined by 2A self-cleaving peptides for optimal processing of the expressed polypeptide resulting in the generation of mature proteins. (B) A schematic diagram on the modified BLT model used in these studies for the generation of chimeric mice carrying MART-1–specific T cells. The thy/liv implant was reconstructed from transduced and nontransduced CD34 cells isolated from an HLA-A*0201 fetal liver. A fraction of the transduced cells is frozen and injected into the irradiated mice 3 wk later. Mice then are assayed over a period of 12 wk. (C) The timeline of the experimental protocol. Briefly, after mice were injected with transduced progenitors (step 4 in B), we allowed T-cell development and peripheral reconstitution. Tumors generally were injected 1 or 2 wk later with 5 × 10⁶ cells per injection. Starting 1 mo after tumor injection, tumor size and T-cell presence were monitored for 6–8 wk; then mice were killed. The spleen, blood, thymic implant, bone marrow, and tumors were collected and assessed for transgenic T-cell functionality. The figure shows the sites of tumor injections. M202 is an HLA*0201+MART+ cell line that could serve as a target for the transgenic CTL, and M207 is an HLA*0201MART+ cell line that could not. NSG, NOD scid gamma, (NOD.Cg-Prkdcscid Il2rgtm1Wjl/SzJ).
Fig. 2.
Fig. 2.
Reconstitution levels and phenotype of MART-1–specific T cells after injection of genetically modified hHSC. One representative experiment is shown, and each panel represents one individual mouse. Blood samples collected 4 wk after the introduction of transduced hHSC were analyzed by flow cytometric analysis for MART-1 TCR expression by tetramer, CD45, CD4, and CD8. The populations shown here are gated on CD45+ cells. Statistical significance was determined by a paired Student's t test (P < 0.05). (A) Levels of CD8 T cells expressing the MART-1 TCR. Percentages shown in bold represent the fraction of CD8 T cells that is tetramer+. (B) Expression of MART-1 TCR in CD4 T cells. Numbers shown in bold indicate the fraction of CD4 T cells expressing the MART-1 TCR. (C) A cumulative dot plot of the CD4 and CD8 T-cell populations in A and B expressing the MART-1 TCR. (D) Blood samples also were stained for CD62L and CD27 to assess the maturation state of CD8+MART-1+ T cells. The majority of cells were CD62L+, suggesting a naïve phenotype.
Fig. 3.
Fig. 3.
MART-1–specific CTLs limit growth of MART-1/HLA-A*0201 melanoma tumors. (A) Surface measurements of tumors from representative mice of two different experiments. The tumors were injected in the left [M202, circles (●)] and right [M207. squares (■)] shoulder. Control mice were transplanted with autologous nontransduced CD34 cells. The tumors were measured 4, 6, and 8 wk after tumor challenge. The end point at week 10 was assessed by PET imaging. (B) Shown is a representative mouse in which the M202 tumor (gray shading) is larger that the M207 tumor. However, PET imaging (red) indicates that glucose uptake is higher in the M207 tumor and that the additional tissue seen in the M202 tumor is mostly necrotic. (C) Levels of FDG uptake by the M202 and M207 tumors in control and treated mice as assessed by PET imaging. Muscle serves as a background control. Statistical significance was determined by one-way ANOVA. (D) Representative PET images from different mice. The circles were added to facilitate the identification of the M202 (Left) and M207 (Right) tumors. Statistical significance for all of the experiments (unless otherwise indicated) was determined by a paired Student‘s t test with significant values set at P < 0.05.
Fig. 4.
Fig. 4.
Detection of TILs in the matched M202 tumor. (A) Total tumor cells were stained for CD45 and MART-1 tetramer and analyzed by flow cytometry to detect TILs. The data indicate percentage of CD45+ cells that are MART-1 TCR-positive by tetramer staining. The levels of CD45+ cells in these tumors ranged from 0.4–0.5% of total cells. Shown are individual mice from one representative experiment. (B) Mice were imaged using an sr39tk-specific probe 6 wk after tumor injection to detect infiltration of transgenic T cells into M202 and M207 tumors. Tumors from the same mouse are matched with the same symbol. Shown are six mice from one representative experiment. Statistical significance was determined by a paired Student‘s t test with significant values set at P < 0.05. %ID/g, injected dose per gram of body weight.
Fig. 5.
Fig. 5.
Ex vivo testing and the phenotype of MART-1–transgenic CTL after in vivo tumor challenge. (A) Splenocytes from mice injected with transduced CD34 were pooled and stimulated ex vivo with MART-1 peptide (1μg/mL) and irradiated feeders. Five days later the cells were used in a CTL killing assay. (B) After mouse culling, splenocytes were collected and used in a CTL assay without any ex vivo stimulation. Transgenic MART-1 CTL from mice injected with transduced progenitors specifically killed the M202 targets but did not kill the M207 controls. Cell cytotoxicities are at an effector:target ratio of 10:1. “Control” indicates splenocytes collected from mice that were injected with nontransduced hHSC and incubated with the M202 targets. Statistical significance for all of the experiments was determined by a paired Student's t test with significant values set at P < 0.05. (C) Samples from blood and spleens of killed mice were collected and used in a FACS-based phenotyping of CD45+CD8+CD3+MART-1+ T cells. Control mice were mice injected with nontransduced autologous hHSC. MART-1–expressing cells displayed higher levels of CD25. (D) From the same animals and cell population as in C, we also examined the maturation state of MART-1 cells. The bar graph below indicates the averages from each group shown in the dot plots above and the statistically significant differences between the treated mice and the controls. Asterisks indicate statistical significance. Statistical analysis of the averages (bar graphs) was determined by a Student's t test with significant values set at P < 0.05 to compare the differences between the control and treated mice. For the dot plots, statistical significance was determined by one-way ANOVA (P < 0.05) comparing the different CD8 T-cell subpopulations.
Fig. 6.
Fig. 6.
Levels of bone marrow reconstitution. Shown is a representative experiment with three different mice. The control mouse was injected with nontransduced autologous progenitors. (A) Bone marrow cells were used in a real-time PCR assay to detect the presence of our lentiviral vector. (B) Progenitor cells were stimulated with SCF (50 ng/mL) and MGDF (100 ng/mL) and were used in a flow cytometric assay to detect expression of sr39tk.
Fig. P1.
Fig. P1.
Generation of functional melanoma-specific CD8 T cells from engineered stem cells in humanized mice. Immunodeficient mice were transplanted with human thymus (an immune cell-producing organ) and with genetically modified human stem cells derived from the same human fetal source. Three weeks later, the mice were irradiated and transplanted with a second set of human stem cells derived from the original fetal donor. Approximately 6 wk after transplantation, the mice were challenged with melanoma (skin cancer) tumors. Mice then were monitored for up to 8 wk, and analyses for maturation and functionality of engineered T cells were performed.

References

    1. Marincola FM, Wang E, Herlyn M, Seliger B, Ferrone S. Tumors as elusive targets of T-cell-based active immunotherapy. Trends Immunol. 2003;24:335–342. - PubMed
    1. Ochsenbein AF. Principles of tumor immunosurveillance and implications for immunotherapy. Cancer Gene Ther. 2002;9:1043–1055. - PubMed
    1. Smyth MJ, Taniguchi M, Street SE. The anti-tumor activity of IL-12: Mechanisms of innate immunity that are model and dose dependent. J Immunol. 2000;165:2665–2670. - PubMed
    1. Chambers CA, Kuhns MS, Egen JG, Allison JP. CTLA-4-mediated inhibition in regulation of T cell responses: Mechanisms and manipulation in tumor immunotherapy. Annu Rev Immunol. 2001;19:565–594. - PubMed
    1. Kalos M, et al. T cells with chimeric antigen receptors have potent antitumor effects and can establish memory in patients with advanced leukemia. Sci Transl Med. 2011;3(95) 95ra73. - PMC - PubMed

Publication types