

Genome-wide antisense transcription drives mRNA processing in bacteria
- PMID: 22123973
- PMCID: PMC3250193
- DOI: 10.1073/pnas.1113521108
Genome-wide antisense transcription drives mRNA processing in bacteria
Abstract
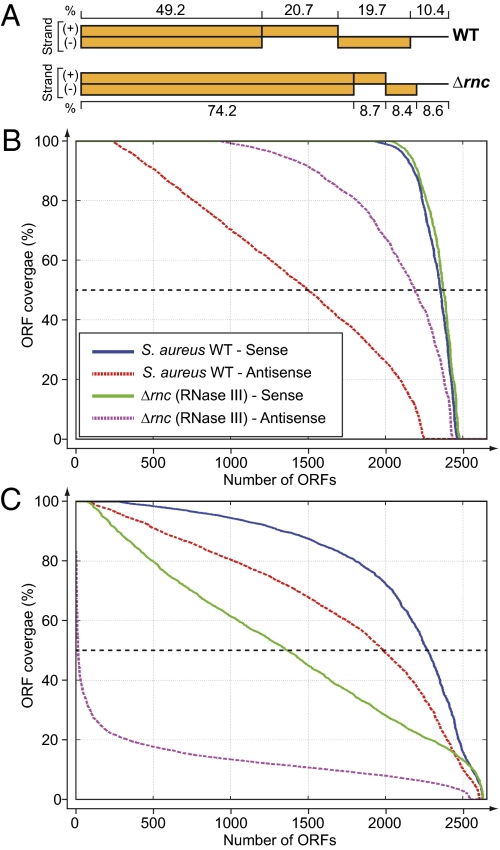
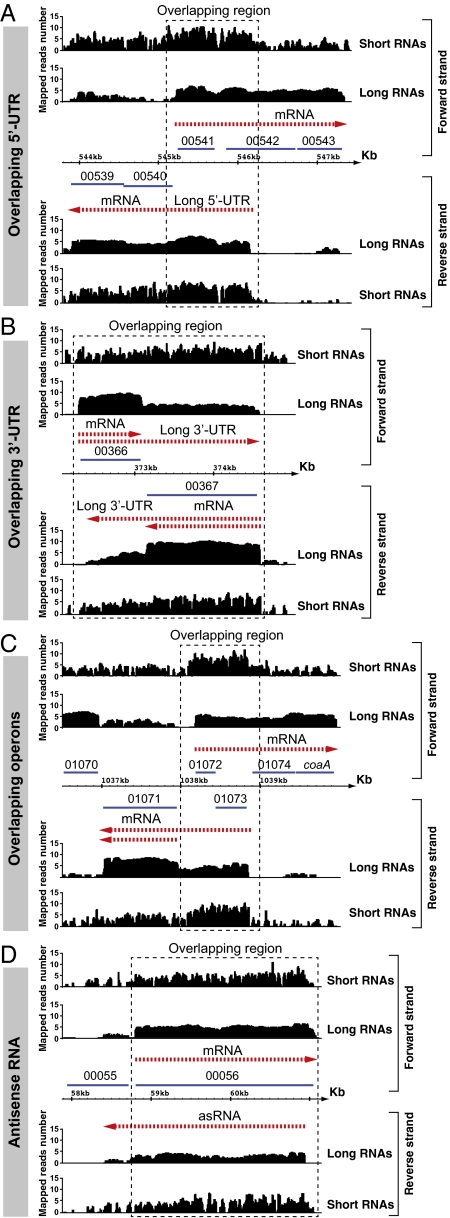
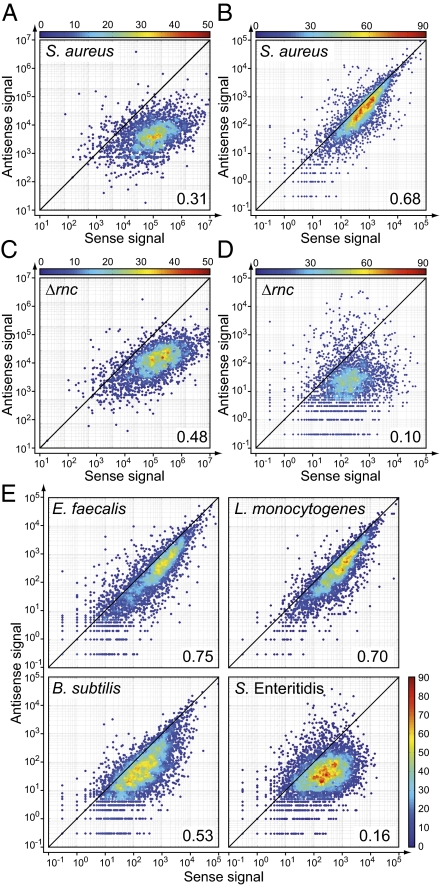
RNA deep sequencing technologies are revealing unexpected levels of complexity in bacterial transcriptomes with the discovery of abundant noncoding RNAs, antisense RNAs, long 5' and 3' untranslated regions, and alternative operon structures. Here, by applying deep RNA sequencing to both the long and short RNA fractions (<50 nucleotides) obtained from the major human pathogen Staphylococcus aureus, we have detected a collection of short RNAs that is generated genome-wide through the digestion of overlapping sense/antisense transcripts by RNase III endoribonuclease. At least 75% of sense RNAs from annotated genes are subject to this mechanism of antisense processing. Removal of RNase III activity reduces the amount of short RNAs and is accompanied by the accumulation of discrete antisense transcripts. These results suggest the production of pervasive but hidden antisense transcription used to process sense transcripts by means of creating double-stranded substrates. This process of RNase III-mediated digestion of overlapping transcripts can be observed in several evolutionarily diverse Gram-positive bacteria and is capable of providing a unique genome-wide posttranscriptional mechanism to adjust mRNA levels.
Conflict of interest statement
The authors declare no conflict of interest.
Figures


Similar articles
-
An effort to make sense of antisense transcription in bacteria.RNA Biol. 2012 Aug;9(8):1039-44. doi: 10.4161/rna.21167. Epub 2012 Aug 1. RNA Biol. 2012. PMID: 22858676 Free PMC article.
-
Global regulatory functions of the Staphylococcus aureus endoribonuclease III in gene expression.PLoS Genet. 2012 Jun;8(6):e1002782. doi: 10.1371/journal.pgen.1002782. Epub 2012 Jun 28. PLoS Genet. 2012. PMID: 22761586 Free PMC article.
-
Tombusvirus p19 Captures RNase III-Cleaved Double-Stranded RNAs Formed by Overlapping Sense and Antisense Transcripts in Escherichia coli.mBio. 2020 Jun 9;11(3):e00485-20. doi: 10.1128/mBio.00485-20. mBio. 2020. PMID: 32518184 Free PMC article.
-
Pervasive transcription: illuminating the dark matter of bacterial transcriptomes.Nat Rev Microbiol. 2014 Sep;12(9):647-53. doi: 10.1038/nrmicro3316. Epub 2014 Jul 28. Nat Rev Microbiol. 2014. PMID: 25069631 Review.
-
The excludon: a new concept in bacterial antisense RNA-mediated gene regulation.Nat Rev Microbiol. 2013 Feb;11(2):75-82. doi: 10.1038/nrmicro2934. Epub 2012 Dec 24. Nat Rev Microbiol. 2013. PMID: 23268228 Review.
Cited by
-
The transcriptional landscape of a rewritten bacterial genome reveals control elements and genome design principles.Nat Commun. 2021 May 24;12(1):3053. doi: 10.1038/s41467-021-23362-y. Nat Commun. 2021. PMID: 34031412 Free PMC article.
-
Identification of a Novel LysR-Type Transcriptional Regulator in Staphylococcus aureus That Is Crucial for Secondary Tissue Colonization during Metastatic Bloodstream Infection.mBio. 2020 Aug 25;11(4):e01646-20. doi: 10.1128/mBio.01646-20. mBio. 2020. PMID: 32843554 Free PMC article.
-
Cis-Natural Antisense Transcripts Are Mainly Co-expressed with Their Sense Transcripts and Primarily Related to Energy Metabolic Pathways during Muscle Development.Int J Biol Sci. 2016 Jul 17;12(8):1010-21. doi: 10.7150/ijbs.14825. eCollection 2016. Int J Biol Sci. 2016. PMID: 27489504 Free PMC article.
-
Genome-wide identification of antisense lncRNAs and their association with susceptibility to Flavobacterium psychrophilum in rainbow trout.Front Immunol. 2022 Dec 6;13:1050722. doi: 10.3389/fimmu.2022.1050722. eCollection 2022. Front Immunol. 2022. PMID: 36561762 Free PMC article.
-
Sinorhizobium meliloti RNase III: Catalytic Features and Impact on Symbiosis.Front Genet. 2018 Aug 28;9:350. doi: 10.3389/fgene.2018.00350. eCollection 2018. Front Genet. 2018. PMID: 30210532 Free PMC article.
References
-
- Selinger DW, et al. RNA expression analysis using a 30 base pair resolution Escherichia coli genome array. Nat Biotechnol. 2000;18:1262–1268. - PubMed
-
- Güell M, et al. Transcriptome complexity in a genome-reduced bacterium. Science. 2009;326:1268–1271. - PubMed
-
- Toledo-Arana A, et al. The Listeria transcriptional landscape from saprophytism to virulence. Nature. 2009;459:950–956. - PubMed
Publication types
MeSH terms
Substances
LinkOut - more resources
Full Text Sources
Other Literature Sources
Molecular Biology Databases
