. 2011 Dec 27;108(52):21276-81.
doi: 10.1073/pnas.1117029108. Epub 2011 Nov 28.

Molecular classification of prostate cancer using curated expression signatures

Affiliations

Molecular classification of prostate cancer using curated expression signatures

Elke K Markert et al. Proc Natl Acad Sci U S A. .

Abstract

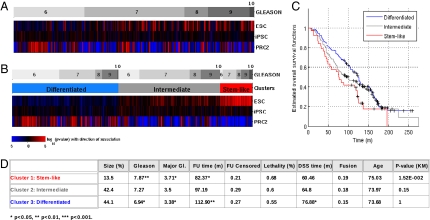
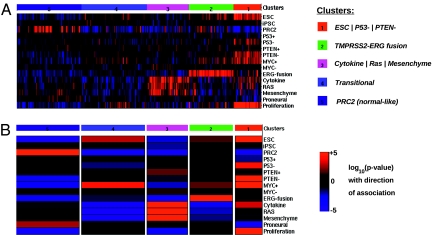
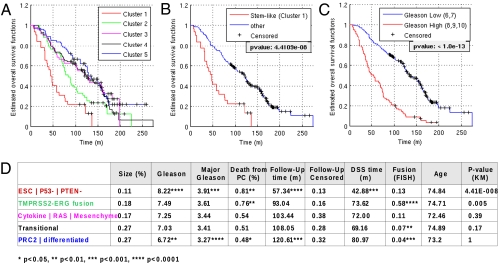
High Gleason score is currently the best prognostic indicator for poor prognosis in prostate cancer. However, a significant number of patients with low Gleason scores develop aggressive disease as well. In an effort to understand molecular signatures associated with poor outcome in prostate cancer, we analyzed a microarray dataset characterizing 281 prostate cancers from a Swedish watchful-waiting cohort. Patients were classified on the basis of their mRNA microarray signature profiles indicating embryonic stem cell expression patterns (stemness), inactivation of the tumor suppressors p53 and PTEN, activation of several oncogenic pathways, and the TMPRSS2-ERG fusion. Unsupervised clustering identified a subset of tumors manifesting stem-like signatures together with p53 and PTEN inactivation, which had very poor survival outcome, a second group with intermediate survival outcome, characterized by the TMPRSS2-ERG fusion, and three groups with benign outcome. The stratification was validated on a second independent dataset of 150 tumor and metastatic samples from a clinical cohort at Memorial Sloan-Kettering Cancer Center. This classification is independent of Gleason score and therefore provides useful unique molecular profiles for prostate cancer prognosis, helping to predict poor outcome in patients with low or average Gleason scores.


Conflict of interest statement

The authors declare no conflict of interest.

Figures

Fig. 1.
Fig. 1.
Signature analysis for stemness signatures (ESC, iPSC, PRC2) reveals stem-like tumors that show a distribution of Gleason scores with significantly increased mean. A total of 281 samples from the Sboner et al. (27) dataset (GSE16560) were analyzed. (A) Heatmap displaying signature scores of the stemness signatures characterizing embryonic stem cells (ESC), induced pluripotent stem cells (iPSC), and PRC2 activity as differentiation signature, after clustering the samples by Gleason score. Colors represent significance of score assignment, with red representing positive enrichment scores and blue negative ones. (B) An unsupervised clustering into three groups on the basis of the signature scores reveals clusters representing stem-like tumors, differentiated tumors, and a third, intermediate group with moderate, weakly significant expression of stem-like features. (C) Kaplan–Meier estimate of overall survival times for the three clusters. (D) Average values of clinical variables for the three clusters. Follow-up (FU) time is listed together with censoring (patients alive at closing of the study). Lethality refers to disease-specific mortality and DSS time denotes disease-specific survival time. Fusion refers to the actual TMPRSS2–ERG fusion status (FISH), and the last column shows P values for the split of curves in the Kaplan–Meier plots associated with the test group versus all other groups having higher mean survival times. Significance was calculated using Fisher's exact test and Student's t test and is indicated by asterisks.
Fig. 2.
Fig. 2.
Clustering by signature profiles reveals distinct molecular subtypes. Samples from Sboner et al. (27) (GSE16560) were clustered using a customized prostate-specific library of expression signatures. Five clusters or subtypes were found by unsupervised clustering. (A) Heatmap of signature scores for single signatures, displaying the distinct molecular features of the subtypes. Shown is the average score for each signature group. Colors indicate significance of the score assignment (red, positive; blue, negative). (B) Schematic representation of the signature profiles of the clusters. Columns represent clusters, colors represent significance of the overall association of a signature with the cluster, red represents positive association with the signature, and blue represents negative association. Width of columns is relative to size of the cluster.
Fig. 3.
Fig. 3.
Clinical analysis of clusters shows graded outcomes with the stem-like group having the poorest outcome. Clinical outcome data available for the Swedish watchful-waiting cohort (Sboner et al.) (27) (GSE16560) were analyzed on the distinct subgroups found by signature profiling. (A–C) Kaplan–Meier estimates for survival functions for the different subgroups, including side-by-side comparison of survival analysis based on signature profiling (A and B) and Gleason score (C). Note that the stem-like group in A and B contains 11% of samples, whereas the group with high Gleason scores in C contains 29% of samples. (D) Clinical variables for the subgroups show a highly significant prognostic value for the stem-like subtype. Follow-up (FU) time is listed together with censoring for overall survival, lethality indicates cases with disease-specific death as determined in the original study, and DSS time refers to disease-specific survival time. Fusion refers to actual TMPRR2–ERG fusion status (FISH). Age distribution was insignificant for all groups. The last column shows the P values for differences in the Kaplan–Meier plots associated with the tested group versus all other groups having higher mean survival times. Significance of assignments is indicated by asterisks.
Fig. 4.
Fig. 4.
Clustering by signature profiles validates distinct subtypes on an independent clinical cohort. mRNA expression data from 185 samples from Taylor et al. (24) (GSE21034) were used as the validation set. Shown are 150 prostate tumor samples contained in this set, 131 primary tumor samples and 19 metastatic tissue samples (29 adjacent tissue samples and 6 cell line samples not shown). Samples were clustered along signature scores as before. Four clusters were found by unsupervised clustering. Clusters emerged with highly similar association patterns as in the Sboner et al. (27) dataset; compare Fig. 2. (A) Heatmap of signature scores for single signatures, displaying the distinct molecular features of the subtypes. Colors indicate significance of the score assignment (red, positive; blue, negative). (B) Schematic representation of the signature profiles of the clusters. Columns represent clusters, colors represent significance of the overall association of a signature with the cluster, red represents positive association with the signature, and blue represents negative association. Width of columns is relative to size of the cluster. (C) Clinical data were available for these samples. Gleason score and PSA were determined at biopsy (diagnosis). Nomogram prediction values are shown for progression-free probability (PFP) and organ-confined disease (OCD). Average values on clusters were calculated and significance was determined using Fisher's exact test for discrete and Student's t test for continuous variables and is indicated by asterisks.

Comment in

  • Profiling prostate cancer.
    Nelson WG. Nelson WG. Proc Natl Acad Sci U S A. 2011 Dec 27;108(52):20861-2. doi: 10.1073/pnas.1118444109. Epub 2011 Dec 15. Proc Natl Acad Sci U S A. 2011. PMID: 22173635 Free PMC article. No abstract available.

References

    1. Perou CM, et al. Molecular portraits of human breast tumours. Nature. 2000;406:747–752. - PubMed
    1. Weigelt B, et al. Molecular portraits and 70-gene prognosis signature are preserved throughout the metastatic process of breast cancer. Cancer Res. 2005;65:9155–9158. - PubMed
    1. Ben-Porath I, et al. An embryonic stem cell-like gene expression signature in poorly differentiated aggressive human tumors. Nat Genet. 2008;40:499–507. - PMC - PubMed
    1. Mizuno H, Spike BT, Wahl GM, Levine AJ. Inactivation of p53 in breast cancers correlates with stem cell transcriptional signatures. Proc Natl Acad Sci USA. 2010;107:22745–22750. - PMC - PubMed
    1. Woo HG, et al. Association of TP53 mutations with stem cell-like gene expression and survival of patients with hepatocellular carcinoma. Gastroenterology. 2010;140:1063–1070. - PMC - PubMed

Associated data