. 2011 Dec;138(6):627-40.
doi: 10.1085/jgp.201110693.

The core domain as the force sensor of the yeast mechanosensitive TRP channel

Affiliations

The core domain as the force sensor of the yeast mechanosensitive TRP channel

Zhenwei Su et al. J Gen Physiol. 2011 Dec.

Abstract

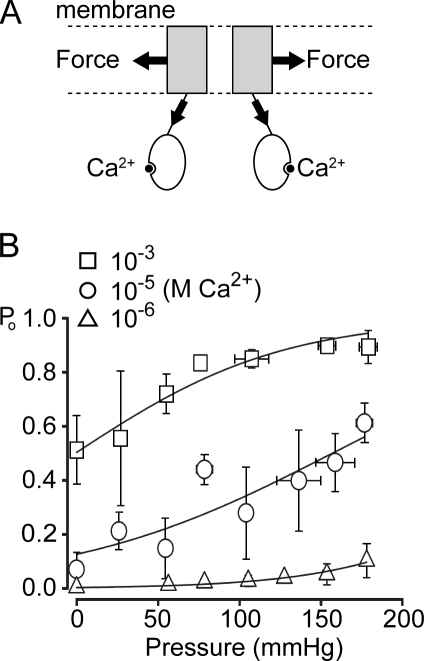
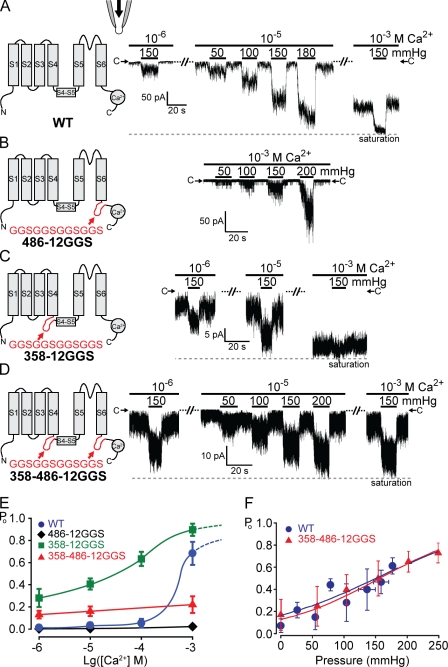
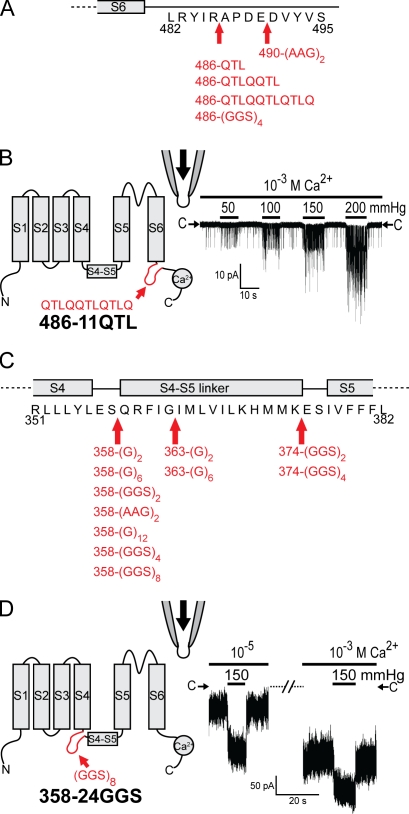
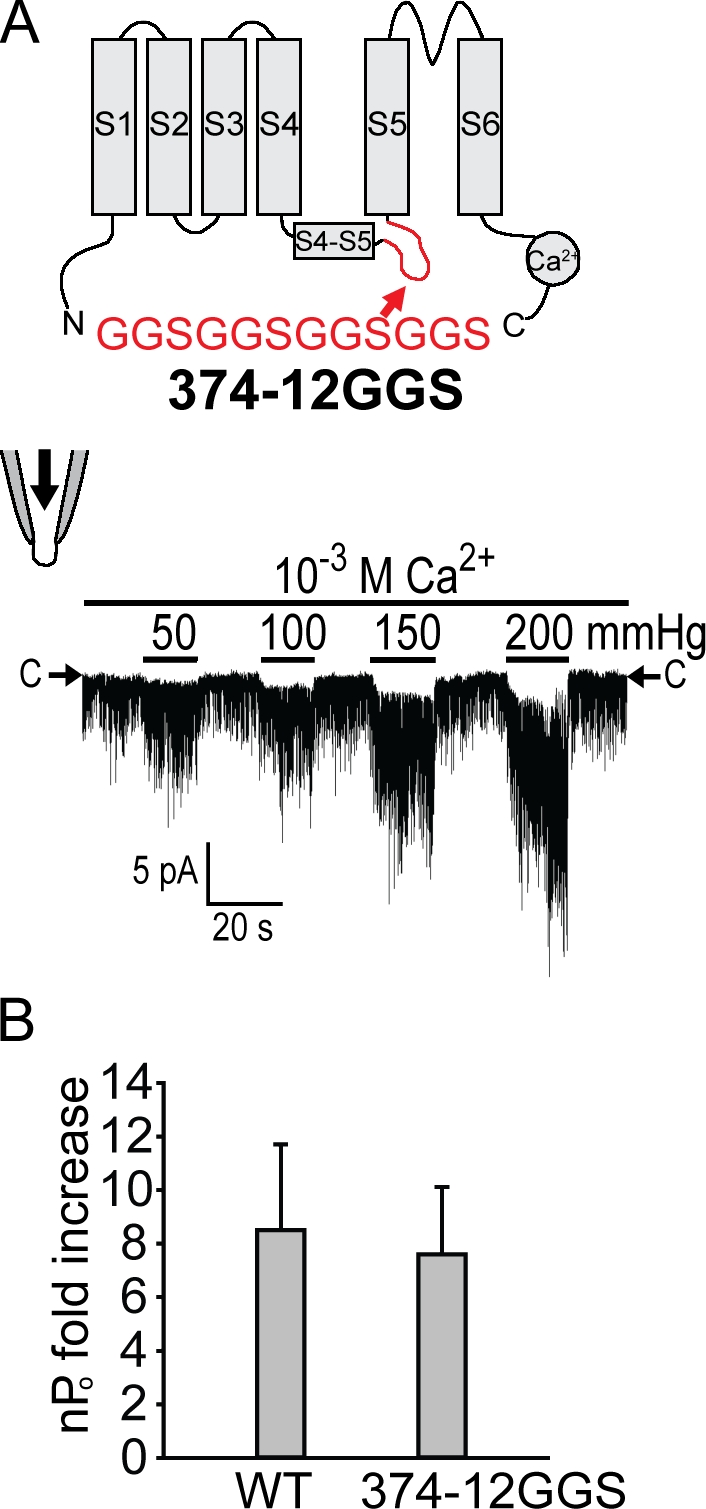
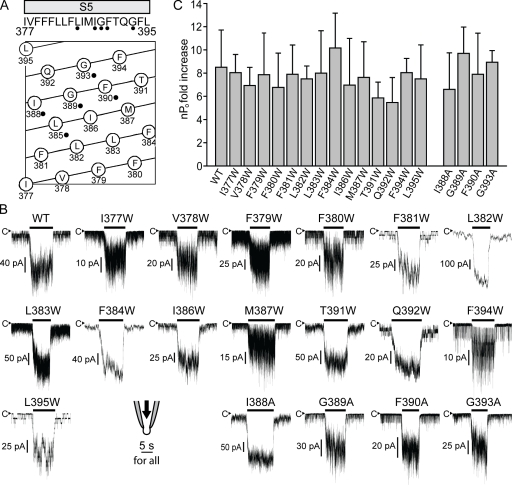
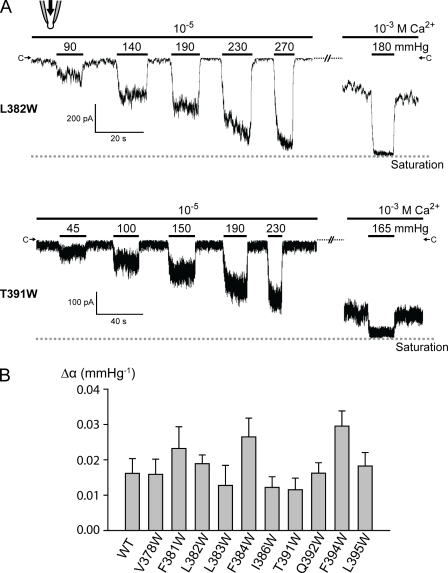
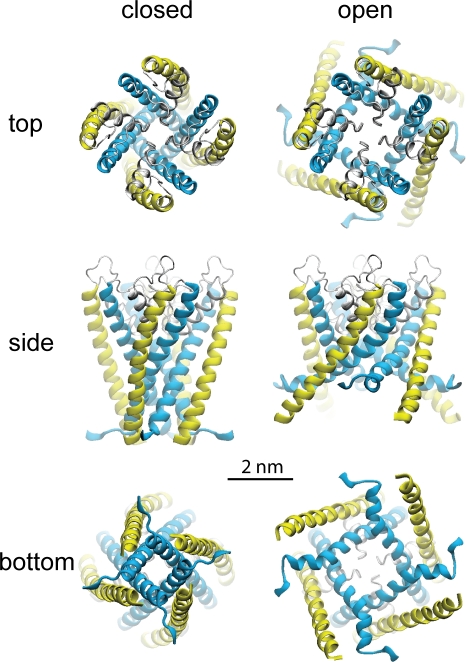
Stretch-activated conductances are commonly encountered in careful electric recordings. Those of known proteins (TRP, MscL, MscS, K(2p), Kv, etc.) all share a core, which houses the ion pathway and the gate, but no recognizable force-sensing domain. Like animal TRPs, the yeast TRPY1 is polymodal, activated by stretch force, Ca(2+), etc. To test whether its S5-S6 core senses the stretch force, we tried to uncouple it from the peripheral domains by strategic peptide insertions to block the covalent core-periphery interactions. Insertion of long unstructured peptides should distort, if not disrupt, protein structures that transmit force. Such insertions between S6 and the C-terminal tail largely removed Ca(2+) activation, showing their effectiveness. However, such insertions as well as those between S5 and the N-terminal region, which includes S1-S4, did not significantly alter mechanosensitivity. Even insertions at both locations flanking the S5-S6 core did not much alter mechanosensitivity. Tryptophan scanning mutations in S5 were also constructed to perturb possible noncovalent core-periphery contacts. The testable tryptophan mutations also have little or no effects on mechanosensitivity. Boltzmann fits of the wild-type force-response curves agree with a structural homology model for a stretch-induced core expansion of ~2 nm(2) upon opening. We hypothesize that membrane tension pulls on S5-S6, expanding the core and opening the TRPY1 gate. The core being the major force sensor offers the simplest, though not the only, explanation of why so many channels of disparate designs are mechanically sensitive. Compared with the bacterial MscL, TRPY1 is much less sensitive to force, befitting a polymodal channel that relies on multiple stimuli.


Figures

Figure 1.
Figure 1.
Bimodal activation of TRPY1. (A) A diagram showing that TRPY1 senses membrane stretch force through the membrane-embedded domains and Ca2+ through the cytoplasmic domains. Energetically, the open probability is governed by ΔG0 − ΔGforce − ΔGCa2+, where ΔG0 refers to the energy difference between the C and O state before the application of force or Ca2+. ΔG0 includes the energies from structures, temperature, protonation, etc. (B) The Po versus pressure plots at different [Ca2+]. For each of the three [Ca2+], Po from TRPY1 ensemble currents is plotted against the applied pressure and fitted with the following Boltzmann equation: Po = 1/[1 + a × exp(−Δα × P)], which is transformed from Po = 1/[1 + exp((ΔE − γ × ΔA)/kB × T)], where a and Δα are fitting parameters in the Popressure plot, with Δα (in millimeters of Hg−1) being the slope parameter; P (in millimeters of Hg) is the applied pressure; ΔE is the free energy of the channel at given [Ca2+]; g (in Newtons per meter) is the membrane tension; ΔA (in square meters) is the expansion coefficient; kB is the Boltzmann constant; and T is the absolute temperature. The transformation assumes that the radius of our patches, r (in meters), remains constant. We strictly controlled the sizes of our pipette tips in a narrow range with the bubble numbers 4.5–5.1 in ethanol(Sakmann and Neher, 1983) to approach the constancy of r. With this assumption, γ can be converted to P according to Laplace’s law. The saturation levels of channel activities were determined by applying high pressure at high [Ca2+] (10−3 M). See Materials and methods for details. Although [Ca2+] laterally shifts Po–pressure curves, all three fits have a similar Δα value (Table I), indicating that Δα defines the mechanosensitivity and is independent of [Ca2+]. Means ± SD (not SEM; n = 4 for 10−3 M, n = 6 for 10−5 M, and n = 4 for 10−6 M Ca2+).
Figure 2.
Figure 2.
Single-channel analysis of the force activation indicating the C1 to burst transition step is mechanosensitive. (A, top) A single-channel recording at 10−6 M Ca2+ in response to different pressures over 5.5 min. (middle) An expanded view of a short portion in the top trace showing different states: an interburst closed state (C1), a burst state comprising an open state (O), and an intraburst closed state (C2). The recording presented here has higher basal Po than average, which facilitated kinetics analysis. (bottom) A minimal kinetics model for TRPY1. (B) All-point histogram of A for dwell time analyses of different states without pressure (0 mmHg; top) and with 150 mmHg of pressure (bottom). The comparison shows that pressure mainly shortens C1 without much affecting O and C2. Also see Table II. (C) The normalized C1 dwell time to that of 0 mmHg of pressure is plotted against pressure at 10−6 M Ca2+ and fitted with an exponential equation: normalized C1 dwell time = b × exp(−Δαk × P), similar to that described in Fig. 1 B. The slope parameter Δαk (Table III) here corresponds to the slope parameter Δα from the ensemble current analysis in Figs. 1 B and 3 F. (D) A plot similar to C at 10−5 M Ca2+. Means ± SD (not SEM; n = 5 for 10−6 M and n = 3 for 10−5 M Ca2+).
Figure 3.
Figure 3.
Inserting unstructured peptides before or after the S5–S6 core domain does not affect force activation. TRPY1 activities were examined in excised cytoplasmic-side-out patches bathed in the symmetric solution held at −50-mV driving inward currents. 10–20-s pressure pulses were delivered into the pipette to exert membrane stretch. (A, left) A diagram of one wild-type (WT) subunit showing S1 through S6, the S4–S5 linker, and a C-terminal Ca2+-binding domain. (right) Typical traces of the wild-type–channel activities from one patch, bathed in low (10−6 M), intermediate (10−5 M), or high [Ca2+] (10−3 M). At each [Ca2+], different amounts of positive pressures were applied as depicted with black bars. Magnitudes of the pressure pulses in millimeters of Hg are labeled. C→ marks the closed current level; the dashed line marks the current maximum. Whereas basal activities increase with [Ca2+], the increase in TRPY1 current upon pressure is clear in all [Ca2+]s and is most evident at intermediate [Ca2+] (10−5 M), where the basal activity is most suitable for the test of the force activation. (B–D) Diagrams and typical results of insertion mutants are arranged as in A. (B) 486-12GGS mutant with a 12-residue peptide (red) inserted at the C-terminal end of S6 greatly reduced Ca2+-induced basal activities. Compare basal activities at high [Ca2+] (10−3 M) between A and B. Nonetheless, pressure-induced responses are robust. (C) 358-12GGS with the 12-residue peptide inserted in front of the S4–S5 linker increased basal activities. Compare basal activities with those in A. Responses to pressure pulses are robust, though partially masked by high basal activities. (D) 358–486-12GGS with the peptide inserted at both sides of the S5–S6 core; pressure responses remain robust. Although A–D show results from typical cases, those from other patches (n = 20 for wild type and n = 6 each for 486-12GGS, 358-12GGS, and 358–486-12GGS) are highly consistent. (E) Plots of Po versus [Ca2+] showing a great reduction of the Ca2+ activation by the peptide insertion at position 486 (diamonds) and an elevation of the basal Po by the insertion at position 358 (squares). 486-12GGS did not reach clear saturation even at high [Ca2+] and under high pressure. Its Po is thus normalized to the highest level we observed and will result in an overestimation. Means ± SD (n = 3 for all). (F) Po versus pressure plots of wild type and 358–486-12GGS at 10−5 M Ca2+ fitted with the Boltzmann equation, the same as Fig. 1 B. Means ± SD (n = 6 for wild type and n = 4 for 358–486-12GGS). No clear difference in mechanosensitivity (Δα) can be discerned. See Table I. The low or high spontaneous activity of 486-12GGS or 358-12GGS, respectively, limited the accurate estimate of Po or the test range of mechanosensitivity and cannot be plotted here.
Figure 4.
Figure 4.
Various insertion mutants before or after the core domain do not affect force activation. (A and C) Diagrams showing insertions with different sequences, different lengths, and different locations. Insertion mutants with no observed functional channels are not depicted in the diagram, which include 369-6GGS, 372-6GGS, 373-6GGS, 375-6GGS, 376-6GGS, 377-6GGS, and 378-6GGS. (B and D) Similar diagrams and recording as in Fig. 3 of 486-11QTL and 358-24GGS, respectively.
Figure 5.
Figure 5.
Inserting unstructured peptides between the S4–S5 linker and S5–S6 core domain does not much affect force activation. (A) A diagram and recording from 374-GGS are presented as in Fig. 3. This insertion shortens the open duration and thus lowers basal activities, which is evident when the activity at 10−3 M Ca2+ here and that of the wild type at the same [Ca2+] shown in Fig. 3 A are compared. (B) An over fivefold increase in nPo observed in both the wild type and 374-12GGS upon 150-mmHg pressure. Because the saturation level could not be determined before lytic pressure even at high [Ca2+] because of its shortened open durations and less stable seal under high pressures compared with wild type, the quantification was conducted using the fold increase of nPo stimulated by 150-mmHg pressure from comparable basal activity between 374-12GGS and wild type at different [Ca2+] (10−3 M for 374-12GGS and 10−5 M for wild type). No clear difference in mechanosensitivity can be discerned by this measure. P = 0.35. Means ± SD (n = 3 for both).
Figure 6.
Figure 6.
Tryptophan substitution mutants on S5 largely retain normal force activation. (A, top) A diagram of the S5 sequence. (bottom) A helical belt diagram produced by DNASTAR showing the relative amino acid positions on S5. Residues, the replacements of which with tryptophan produced constitutive channel activities, are labeled with black dots. Those were replaced with alanine for further analyses. (B) Representative traces of wild type (WT) and 14 tryptophan mutants and 4 alanine mutants showing robust force responses to 150-mmHg pressure. Whereas the wild type was tested at 10−5 M Ca2+, the mutants were examined at different [Ca2+] to better demonstrate their responses to pressure from appropriate basal activities, as many of these mutants affect basal activities and channel kinetics like the insertion mutants in Figs. 3 and 5. (C) Quantifications of the mechanosensitivity of wild type and mutants in B as the nPo fold increase in response to 150-mmHg pressure. No significant difference can be discerned by this measure. P > 0.05. For those mutants whose saturation level could be determined, Δα values are compared with wild type in Fig. 7. Means ± SD (n = 4 for wild type and n = 3 for each mutant).
Figure 7.
Figure 7.
Tryptophan substitution mutants on S5 largely retain mechanosensitivity as quantified with Δα. (A) Similar recordings as in Fig. 3 of L382W and T391W showing representative tryptophan mutant channels whose saturation level can be determined at high [Ca2+] under high pressure. (B) Δα extracted from a similar plot as in Fig. 1 B and Fig. 3 F were compared among wild type and 10 different tryptophan mutants on S5 whose saturation level can be determined at high [Ca2+] under high pressure. See Materials and methods for the determination of the saturation level. None of the mutants show significantly reduced Δα, whereas F384W and F394W showed slightly increased Δα (between the wild type and 10 tryptophan mutants; P > 0.05 except for F384W and F394W). Means ± SD (n = 6 for wild type and n = 3 for each mutant).
Figure 8.
Figure 8.
A homology model of the S5–S6 core domain of the TRPY1 channel to visualize the nature of the in-plane expansion upon opening. The computational model was constructed using the ROSETTA algorithm (Simons et al., 1997) based on limited homology between TRPY1 and K+ channels (see supplemental information in Zhou et al., 2007). For clarity, only residues from 363 to 472 are shown as ribbons. Upon opening, both the external S5 helices (yellow) and the pore-lining S6 helices (blue) are modeled to bend, tilt, and expand driven by membrane tension.

References

    1. Arnadóttir J., Chalfie M. 2010. Eukaryotic mechanosensitive channels. Annu Rev Biophys. 39:111–137 10.1146/annurev.biophys.37.032807.125836 - DOI - PubMed
    1. Bertl A., Slayman C.L. 1990. Cation-selective channels in the vacuolar membrane of Saccharomyces: dependence on calcium, redox state, and voltage. Proc. Natl. Acad. Sci. USA. 87:7824–7828 10.1073/pnas.87.20.7824 - DOI - PMC - PubMed
    1. Beyder A., Rae J.L., Bernard C., Strege P.R., Sachs F., Farrugia G. 2010. Mechanosensitivity of Nav1.5, a voltage-sensitive sodium channel. J. Physiol. 588:4969–4985 10.1113/jphysiol.2010.199034 - DOI - PMC - PubMed
    1. Booth I.R., Edwards M.D., Black S., Schumann U., Miller S. 2007. Mechanosensitive channels in bacteria: signs of closure? Nat. Rev. Microbiol. 5:431–440 10.1038/nrmicro1659 - DOI - PubMed
    1. Boukalova S., Marsakova L., Teisinger J., Vlachova V. 2010. Conserved residues within the putative S4-S5 region serve distinct functions among thermosensitive vanilloid transient receptor potential (TRPV) channels. J. Biol. Chem. 285:41455–41462 10.1074/jbc.M110.145466 - DOI - PMC - PubMed

Publication types

MeSH terms