. 2012 Feb 1;590(3):575-94.
doi: 10.1113/jphysiol.2011.220780. Epub 2011 Nov 28.

Measurement and simulation of myoplasmic calcium transients in mouse slow-twitch muscle fibres

Affiliations

Measurement and simulation of myoplasmic calcium transients in mouse slow-twitch muscle fibres

Stephen Hollingworth et al. J Physiol. .

Abstract

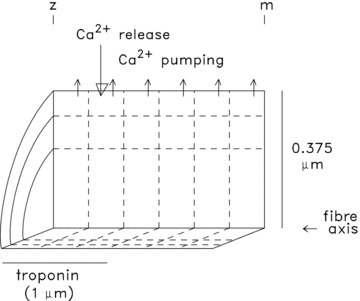
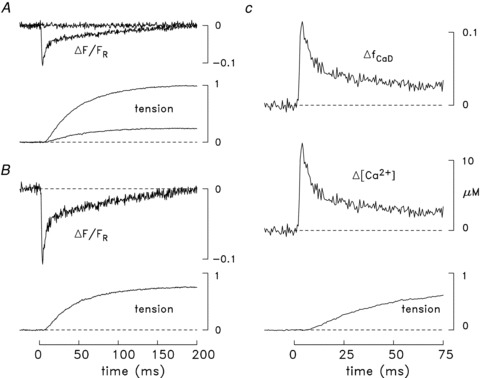
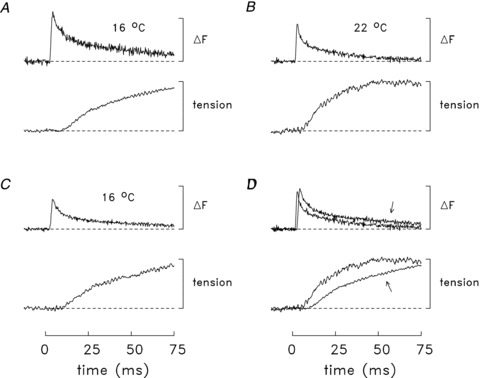
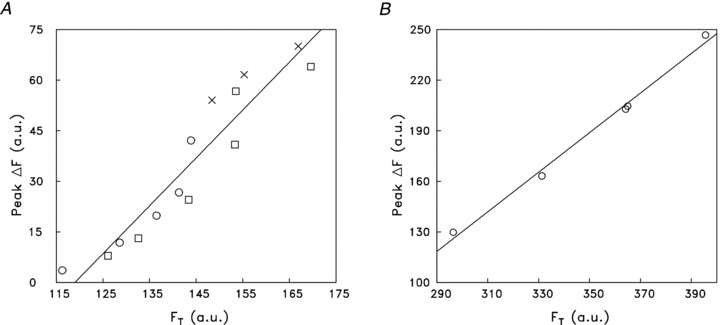
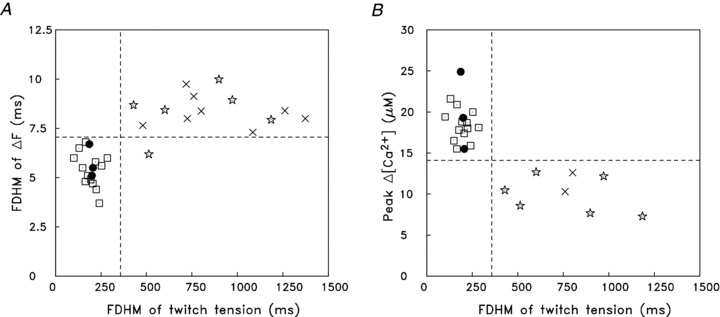
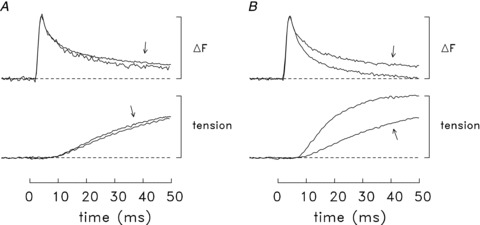
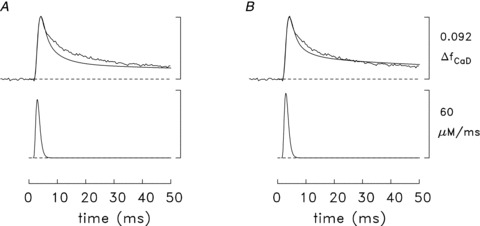
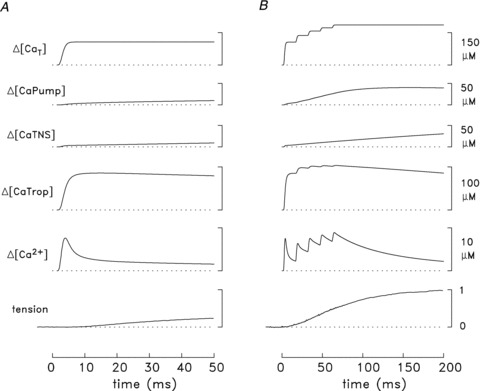
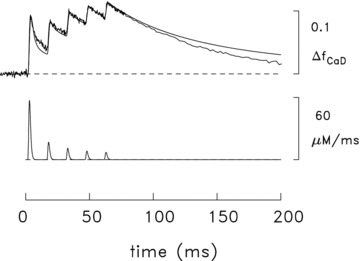
Bundles of intact fibres from soleus muscles of adult mice were isolated by dissection and one fibre within a bundle was micro-injected with either furaptra or mag-fluo-4, two low-affinity rapidly responding Ca(2+) indicators. Fibres were activated by action potentials to elicit changes in indicator fluorescence (ΔF), a monitor of the myoplasmic free Ca(2+) transient ([Ca(2+)]), and changes in fibre tension. All injected fibres appeared to be slow-twitch (type I) fibres as inferred from the time course of their tension responses. The full-duration at half-maximum (FDHM) of ΔF was found to be essentially identical with the two indicators; the mean value was 8.4 ± 0.3 ms (±SEM) at 16°C and 5.1 ± 0.3 ms at 22°C. The value at 22°C is about one-third that reported previously in enzyme-dissociated slow-twitch fibres that had been AM-loaded with mag-fluo-4: 12.4 ± 0.8 ms and 17.2 ± 1.7 ms. We attribute the larger FDHM in enzyme-dissociated fibres either to an alteration of fibre properties due to the enzyme treatment or to some error in the measurement of ΔF associated with AM loading. ΔF in intact fibres was simulated with a multi-compartment reaction-diffusion model that permitted estimation of the amount and time course of Ca(2+) release from the sarcoplasmic reticulum (SR), the binding and diffusion of Ca(2+) in the myoplasm, the re-uptake of Ca(2+) by the SR Ca(2+) pump, and Δ[Ca(2+)] itself. In response to one action potential at 16°C, the following estimates were obtained: 107 μm for the amount of Ca(2+) release; 1.7 ms for the FDHM of the release flux; 7.6 μm and 4.9 ms for the peak and FDHM of spatially averaged Δ[Ca(2+)]. With five action potentials at 67 Hz, the estimated amount of Ca(2+) release is 186 μm. Two important unknown model parameters are the on- and off-rate constants of the reaction between Ca(2+) and the regulatory sites on troponin; values of 0.4 × 10(8) m(-1) s(-1) and 26 s(-1), respectively, were found to be consistent with the ΔF measurements.


Figures

Figure 1
Figure 1. Compartment geometry of a half-sarcomere of a myofibril in the simulation of Ca2+ movements in mouse slow-twitch fibres
The myoplasmic volume is divided into 18 equal-volume compartments (6 longitudinal × 3 radial) at a half-sarcomere length of 2 μm. The large downward arrow denotes the location at which SR Ca2+ enters the myoplasm; the small upward arrows denote the location of Ca2+ pumping by the SR Ca2+ pump. Troponin is restricted to the 9 compartments located within 1 μm of the z-line (the region containing the thin filaments, average length ∼1 μm). Because the buffer concentrations in Table 1 represent averages over the full myoplasmic volume, the compartment concentration of Ca2+ pump molecules in the 6 pumping compartments is 3 times that in Table 1 (288 rather than 96 μm); similarly, the compartment concentration of troponin molecules in the 9 troponin-containing compartments is 240 rather than 120 μm. The vertical and horizontal calibrations are not to scale.
Figure 2
Figure 2. Ca2+ and tension transients elicited by an action potential in a soleus bundle that contained one fibre injected with furaptra
In all panels, zero time denotes the moment the bundle was stimulated by an external shock. A, the traces labelled ΔF/FR are the fluorescence responses to sub- and supra-threshold stimuli for eliciting an all-or-none ΔF response from the injected fibre. The other pair of traces shows the sub- and supra-threshold tension responses from the bundle. The time of half-rise, time of peak and FDHM of the sub-threshold tension response are 42, 180 and 617 ms, respectively; the corresponding values for the supra-threshold response are 37, 189 and 827 ms. B, difference fluorescence and tension records obtained from the corresponding pairs of traces in A. Because the sub-threshold ΔF/FR trace was virtually flat, it was heavily smoothed prior to subtraction from the supra-threshold ΔF/FR trace, thereby avoiding an unnecessary increase in the noise level of the difference ΔF/FR trace. Peak ΔF/FR is –0.106. C, the ΔfCaD and ΔµCa2+½ traces were calculated from the ΔF/FR trace in B with eqns (1) and (2); these traces, along with the tension trace from B, are shown displayed on a faster time base. The time of half-rise, time of peak, and FDHM of ΔfCaD are 2.6, 3.5 and 8.8 ms, respectively; the corresponding values for ΔµCa2+½ are 2.6, 3.5 and 7.3 ms. Peak ΔfCaD and peak ΔµCa2+½ are 0.113 and 12.2 μm, respectively. In all panels, the tension traces are shown relative to the maximum change elicited by the supra-threshold stimulus in A. The supra-threshold ΔF/FR signal is an averaged response of 14 single sweeps, measured 11–27 min after injection. Fibre 042911.1; sarcomere spacing, 3.6 μm; 16°C.
Figure 3
Figure 3. Fluorescence and tension transients elicited by an action potential in a soleus bundle that contained one fibre injected with mag-fluo-4
In all panels, the traces are difference fluorescence and tension records of the type shown in Fig. 2B. The sub-threshold ΔF responses (not shown) were not detectably different from baseline. The measurements were made at 16°C (A), then at 22°C (B) and finally at 16°C (C). The times of half-rise, time of peak, and FDHM of the ΔF responses are: 3.0, 4.0 and 9.5 ms (A), 2.2, 3.0 and 4.8 ms (B) and 3.4, 4.5 and 7.3 ms (C). The corresponding values for the tension responses are: 33, 171 and 760 ms (A), 18, 66 and 319 ms (B), and 36, 167 and 841 ms (C). The calibration bar for the ΔF traces is 20 arbitrary fluorescence units. In each panel, the tension traces are shown relative to their maximum value during the twitch. In D, the faster trace in each pair is a redisplay of the corresponding trace in B; the slower trace (arrowed) is the average of the corresponding traces in A and C. In A, B and C, the ΔF traces are averages of 4, 11 and 12 sweeps, respectively; the times of the measurements were 46–54, 58–65 and 68–87 min after injection, respectively. Fibre 063011.1; sarcomere spacing, 3.9 μm; fibre diameter, 28 μm.
Figure 4
Figure 4. Indirect estimation of ΔF/FR during a twitch in two experiments with mag-fluo-4
In each panel, the symbols show results from a slow-twitch fibre at 16°C in which a series of measurements of FT (total resting fluorescence of the bundle, which includes indicator-related and non-indicator fluorescence) and ΔF were made at different distances from the site of mag-fluo-4 injection (–600 to +600 μm in A, 8–20 min after injection; 500–800 μm in B, 85–94 min after injection). Fluorescence intensities are given in arbitrary units (a.u.). Crosses denote measurements at the injection site; circles and squares denote measurements on opposite sides of the injection site. In each panel, the line is the least-squares fit of the data with the function: ΔF=aFT+b. The fitted values of a and b are 1.42 and –169 in A and 1.17 and –222 in B. a gives the estimate of ΔF/FR in the experiment (see text), whereas –b/a estimates the non-indicator-related fluorescence (119 in A; 189 in B), which is assumed to remain the same as measurement location is changed. Fibres 063011.1 (A) and 062811.2 (B).
Figure 5
Figure 5. Properties of the myoplasmic Ca2+ transient and twitch tension elicited by an action potential in mouse soleus and EDL fibres at 16°C
A, the FDHM of ΔF is plotted against the FDHM of twitch tension for 16 fibres from EDL muscles (open squares and filled circles) and 14 fibres from soleus muscles (stars and crosses). ΔF was measured with furaptra in all EDL fibres and in 6 of the soleus fibres (stars); ΔF in the remaining soleus fibres was measured with mag-fluo-4 (crosses). All data are from Balb-C (white) mice except for 3 of the EDL experiments, which are from BL/10 (black) mice (indicated by filled circles) (cf. Hollingworth et al. 2008)). B, plot similar to A except that the ordinate is peak ΔµCa2+½ calculated from the peak of furaptra's ΔF/FR with eqns (1) and (2). Peak ΔµCa2+½ in the two mag-fluo-4 experiments (crosses) was calibrated indirectly under the assumption that, if the fluorescence measurement had been made with furaptra, peak ΔF/FR would have been (minus) one-thirteenth of that measured with mag-fluo-4 (see text). Based on the FDHM of twitch tension, all EDL fibres appear to be fast-twitch fibres and all soleus fibres appear to be slow-twitch fibres (cf. dashed vertical line in each panel, the position of which clearly separates the fibres into two functional groups that match their muscle of origin). The values on the ordinates are also strongly correlated with the fibre types, as the positions of the horizontal dashed lines do almost as well at distinguishing the fibres according to their muscle of origin. (Note: tension was not recorded in two EDL experiments in Hollingworth et al. (1996, 2008), thus the indicator-related data from these experiments could not be included in the plots.)
Figure 6
Figure 6. Comparison of normalized ΔF and tension time courses elicited by an action potential at 16°C
In all panels, the traces are averaged results from a number of similar experiments; fibres were included only if ΔF appeared to be unaffected or little affected by movement artifacts on the time scale shown. Traces of similar type are displayed normalized to the same peak amplitude. Prior to inclusion in the averages, the traces for any particular experiment were temporally shifted by up to 1 ms so as to bring the rising phase of its ΔF signal into alignment with that of the other ΔF traces; this shift allows for slight fibre differences in action potential timing. A, slow-twitch experiments with furaptra (n= 5) vs. those with mag-fluo-4 (arrows; n= 6). B, fast-twitch (EDL) fibres (n= 7) vs. slow-twitch (soleus) fibres (arrows; n= 11). The fast-twitch experiments utilized furaptra only; the slow-twitch experiments utilized furaptra (n= 5) and mag-fluo-4 (n= 6). Note that the average amplitude of ΔµCa2+½ itself is approximately twofold larger in fast-twitch fibres than in slow-twitch fibres (cf. Fig. 5B and column 5 of Table 2)).
Figure 7
Figure 7. Measured and simulated spatially averaged waveforms in mouse slow-twitch fibres stimulated by an action potential (16°C)
In each part, the upper pair of traces shows the measured ΔfCaD waveform (noisy trace) and a simulated version of ΔfCaD (noise-free trace, calculated with the multi-compartment model); the lower trace shows the SR Ca2+ release waveform used to drive the simulation. The noisy ΔfCaD trace is the same as the arrowed ΔfCaD trace in Fig. 6B but with its amplitude scaled to 0.092, the mean value measured with furaptra (column 5 of Table 2A)). In A, the model parameters described in Methods were used; in B, the model utilized slightly higher rate constants for the reaction of Ca2+ with the troponin regulatory sites (see text and ‘final values’ of the troponin regulatory-site rate constants in Table 1B)). The amplitude of each flux waveform was adjusted so that the peak of the simulated ΔfCaD waveform was 0.092, the same as the measured value. ΔµCaT½, the simulated amount of released Ca2+, was 97 μm in A and 107 μm in B; the peak of the release flux was 51.9 μm ms-1 in A and 57.4 μm ms-1 in B. The calibration bars at the right apply to both panels.
Figure 8
Figure 8. Additional details related to the simulations and measurements in slow-twitch fibres
Responses to a single action potential are shown in A and to five action potentials at 67 Hz in B. The labels and calibration bars apply to both parts of the figure. The lowermost trace in each panel is an averaged tension response measured from several fibres (11 in A, 3 in B). The remaining traces are spatially averaged simulated traces obtained with the final values of the rate constants for the troponin regulatory sites (Table 1)), i.e. as in Figs 7B and 9. ΔµCa2+½ is the change in free µCa2+½; ΔµCaTrop½, ΔµCaTNS½, and ΔµCaPump½ are the changes in Ca2+ occupancy of the troponin regulatory sites, the troponin non-specific sites, and the transport sites on the SR Ca2+ pump, respectively; and ΔµCaT½ is the total amount of Ca2+ released by the SR. ΔµCaT½ due to one action potential is 107 μm in A and 106 μm in B; in B,ΔµCaT½ due to all five action potentials is 186 μm. The value of 1.0 on the tension calibration corresponds to the average peak tension change elicited by the five action potentials. This was 2.8 ± 0.4 times that elicited by a single action potential in these three experiments; accordingly, the tension record in A has been scaled so that its peak value, which occurs at t= 192 ms (not shown), is 0.357 relative units (= 1/2.8).
Figure 9
Figure 9. Measured and simulated spatially averaged waveforms in mouse slow-twitch fibres stimulated by five action potentials at 67 Hz (16°C)
The noise-free traces are simulated traces of the type described in Fig. 7. The simulated amounts of SR Ca2+ release with the five action potentials are 106, 31, 21, 15 and 13 μm, respectively. The trace with noise is an averaged ΔF signal measured in three experiments, one with furaptra and two with mag-fluo-4; the amplitude of the waveform has been referred to ΔfCaD measured with furaptra. In the furaptra experiment (fibre 062597.1), the measured ΔF/FR signal was converted to ΔfCaD with eqn (1). In one of the mag-fluo-4 experiments (fibre 063011.1), the measured fluorescence signal was indirectly calibrated in units of furaptra ΔfCaD as described in connection with Fig. 5B; in the other mag-fluo-4 experiment (fibre 062811.1), the signal amplitude was scaled so that peak ΔfCaD would be 0.091 in response to the first action potential, which is the average value determined for this peak in the other two experiments. The noise level in the measured trace changes at t≍ 78 ms due to a data-compression (averaging) routine in the data-taking program.

Similar articles

Cited by

References

    1. Baylor SM, Chandler WK, Marshall MW. Sarcoplasmic reticulum calcium release in frog skeletal muscle fibres estimated from arsenazo III calcium transients. J Physiol. 1983;344:625–666. - PMC - PubMed
    1. Baylor SM, Hollingworth S. Model of sarcomeric Ca2+ movements, including ATP Ca2+ binding and diffusion, during activation of frog skeletal muscle. J Gen Physiol. 1998;112:297–316. - PMC - PubMed
    1. Baylor SM, Hollingworth S. Sarcoplasmic reticulum calcium release compared in slow-twitch and fast-twitch fibres of mouse muscle. J Physiol. 2003;551:125–138. - PMC - PubMed
    1. Baylor SM, Hollingworth S. Simulation of Ca2+ movements within the sarcomere of fast-twitch mouse fibers stimulated by action-potentials. J Gen Physiol. 2007;130:283–302. - PMC - PubMed
    1. Baylor SM, Hollingworth S. Calcium indicators and calcium signalling in skeletal muscle fibres during excitation-contraction coupling. Prog Biophys Mol Biol. 2011;105:162–179. - PMC - PubMed

Publication types