. 2012 Feb 15;590(4):763-76.
doi: 10.1113/jphysiol.2011.219907. Epub 2011 Nov 28.

Rapid reversal of impaired inhibitory and excitatory transmission but not spine dysgenesis in a mouse model of mental retardation

Affiliations

Rapid reversal of impaired inhibitory and excitatory transmission but not spine dysgenesis in a mouse model of mental retardation

Andrew D Powell et al. J Physiol. .

Abstract

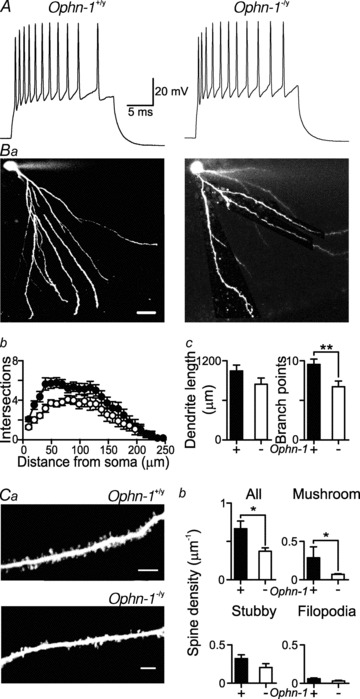
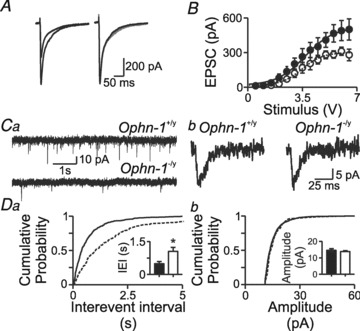
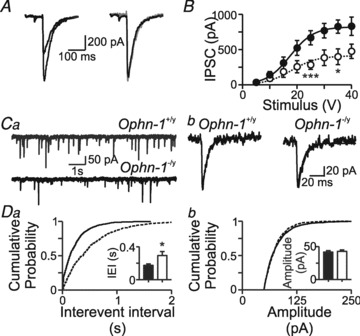
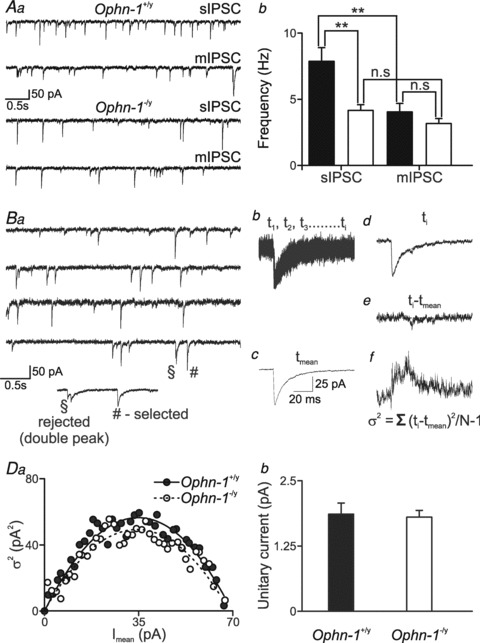
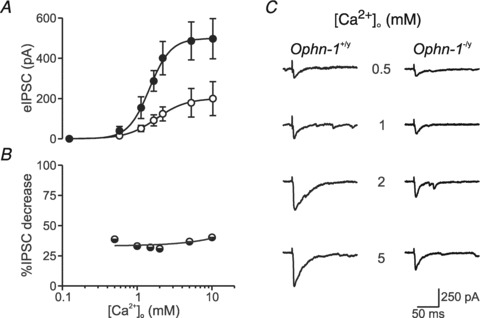
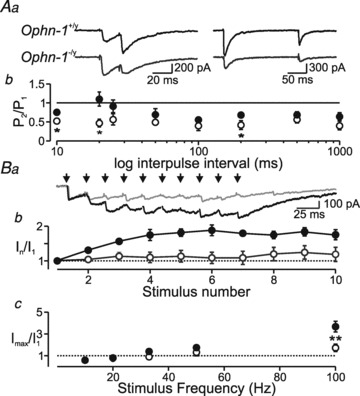
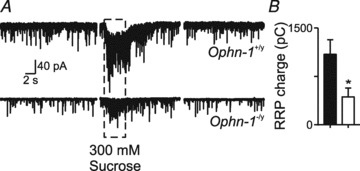
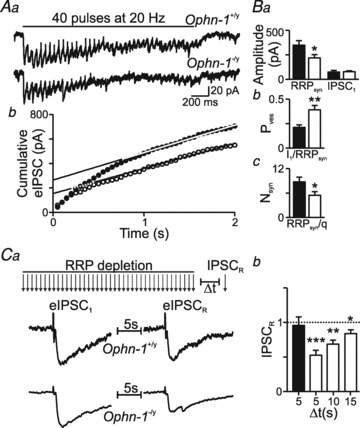
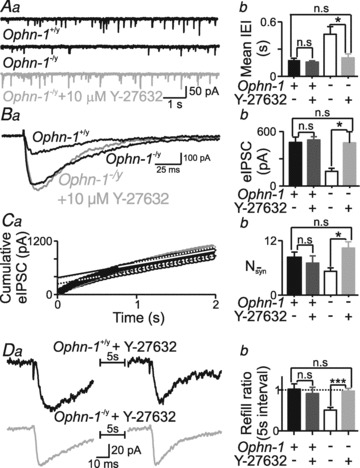
Intellectual disability affects 2-3% of the population: those due to mutations of the X-chromosome are a major cause of moderate to severe cases (1.8/1000 males). Established theories ascribe the cellular aetiology of intellectual disability to malformations of dendritic spines. Recent work has identified changes in synaptic physiology in some experimental models. Here, we investigated the pathophysiology of a mouse model of intellectual disability using electrophysiological recordings combined with confocal imaging of dentate gyrus granule neurons. Lack of oligophrenin-1 resulted in reductions in dendritic tree complexity and mature dendritic spine density and in evoked and spontaneous EPSCs and IPSCs. In the case of inhibitory transmission, the physiological change was associated with a reduction in the readily releasable pool and vesicle recycling which impaired the efficiency of inhibitory synaptic transmission. Acute inhibition of the downstream signalling pathway of oligophrenin-1 fully reversed the functional changes in synaptic transmission but not the dendritic abnormalities. The impaired inhibitory (as well as excitatory) synaptic transmission at frequencies associated with cognitive function suggests a cellular mechanism for the intellectual disability, because cortical oscillations associated with cognition normally depend on inhibitory neurons firing on every cycle.


Figures

Figure 1
Figure 1. Dendritic arborisation and spine density is altered in Ophn-1−/y neurons without alteration in firing characteristics
A, representative responses to a 300 pA depolarising current injection in Ophn-1+/y (left panel) and Ophn-1−/y neurons (right panel) (see also Table 1). Ba, representative images of dentate gyrus granule neurons filled with Alexa 488 from Ophn-1+/y (left) and Ophn-1−/y neurons (right); scale bars represent 20 μm. Bb, Sholl analysis showed that dendritic arborisation was reduced in Ophn-1−/y neurons (open circles). Bc, the number of branch points (right panel) but not the total dendritic length (left panel) was reduced in Ophn-1−/y neurons (**P < 0.01). Ca, dendritic spines were more sparse in Ophn-1−/y (lower panel) than Ophn-1+/y (upper panel) neurons, resulting in a lower overall spine density (Cb), which was largely due to a reduction in the density of ‘mushroom’ spines (upper right panel); the density of ‘stubby’ spines (lower left panel) and filopodia (lower right panel) were unaffected (scale bars represent 5 μm). *P < 0.05.
Figure 2
Figure 2. Excitatory neurotransmission onto dentate gyrus granule cells is reduced in Ophn-1-/y neurons
A, evoked EPSCs were smaller in Ophn-1-/y than Ophn-1+/y neurons. Normalisation (right panel) of the Ophn-1-/y EPSC (grey trace) revealed that the kinetics of the EPSCs were unaltered by genotype. B, input–output relationships of EPSCs were fitted by a Boltzmann function, which showed that the maximal amplitude was smaller in Ophn-1-/y neurons (open circles) than in Ophn-1+/y neurons (filled circles). Other fit parameters did not differ between genotypes. Ca, spontaneous EPSCs were less frequent in Ophn-1−/y (lower trace) than Ophn-1+/y (upper trace) neurons. The kinetics and amplitudes of spontaneous EPSCs did not differ between the genotypes (Cb). Da, cumulative probability plots showed that spontaneous events in Ophn-1-/y neurons shifted to longer interevent intervals (IEIs)/lower frequencies (IEI:Ophn-1-/y dotted line, Ophn-1+/y continuous line); mean IEI (inset) was longer in Ophn-1-/y neurons (*P < 0.05). Db, cumulative probability plot and mean amplitude (inset) of spontaneous EPSCs were unaltered.
Figure 3
Figure 3. Inhibitory neurotransmission onto dentate gyrus granule cells is reduced in Ophn-1-/y neurons
A, evoked IPSCs were smaller in Ophn-1-/y than Ophn-1+/y neurons. Normalisation (right panel) of the Ophn-1-/y IPSC (grey trace) revealed that the kinetics of the IPSCs were unaltered by genotype. B, input–output relationships of IPSCs were fitted by a Boltzmann function, which showed that the maximal amplitude was smaller in Ophn-1-/y neurons (open circles) than in Ophn-1+/y neurons (filled circles). Other fit parameters did not differ between genotypes. Ca, spontaneous IPSCs were less frequent in Ophn-1−/y (lower trace) than Ophn-1+/y (upper trace) neurons. The kinetics and amplitudes of spontaneous IPSCs did not differ between the genotypes (Cb). Da, cumulative probability plots showed that spontaneous events in Ophn-1-/y neurons shifted to longer interevent intervals (IEIs)/lower frequencies (IEI: Ophn-1-/y dotted line, Ophn-1+/y continuous line); mean IEI (inset) was longer in Ophn-1-/y neurons (*P < 0.05). Db, cumulative probability plot and mean amplitude (inset) of spontaneous IPSCs were unaltered.
Figure 4
Figure 4. Peak-scaled noise analysis of miniature IPSCs revealed no difference in GABAA unitary current in Ophn-1-/y neurons
Superfusion of tetrodotoxin (1 μm) reduced the frequency of spontaneous IPSCs in Ophn-1+/y (Aa upper traces and Ab), but not Ophn1−/y neurons (Aa lower traces and Ab). B, protocol for peak-scaled noise analysis of miniature IPSCs. Ba, consecutive miniature recordings used to select events without double peaks or anomalous noise. Bb, 91 superimposed mIPSCs, selected as shown in Ba. Bc, mean waveform of selected events; d, a mIPSC superimposed on the scaled mean waveform; e, difference between the scaled mean waveform and the individual mIPSC; f, σ2 calculated by summing the squares of the difference traces divided by N– 1. Ca, relationship between mean current and peak-scaled variance obtained from Ophn-1+/y (filled circles) and Ophn-1-/y neurons (open circles). b, mean unitary currents in Ophn-1+/y and Ophn-1-/y neurons.
Figure 5
Figure 5. Ca2+ dependence of GABAergic transmission is unaltered in Ophn-1-/y neurons
A, mean evoked IPSC vs.{Ca2+}o fitted with a Hill equation: I =Imax{Ca2+}n/({Ca2+}n+Kd). Evoked IPSCs were smaller in Ophn-1−/y neurons, without alteration in the Hill coefficient (n) or Kd. B, percentage decrease in evoked IPSCs in Ophn-1−/y neurons remained constant at different {Ca2+}o levels relative to evoked IPSCs recorded from Ophn-1+/y neurons. C, representative evoked IPSCs recorded in the presence of different {Ca2+}o.
Figure 6
Figure 6. Responses to repetitive stimulation are reduced in Ophn-1-/y neurons
Aa, single-sweep recordings of double-pulse stimulation at stimuli that evoked 30% of the maximal IPSC when delivered singly, at intervals of 20 and 200 ms. Ab, the conditioned IPSC was isolated by digitally subtracting a single IPSC. The charge carried by the 2nd IPSC (normalized to the charge of the 1st IPSC) is plotted against paired pulse intervals for 6 Ophn-1−/y (open circles) and 8 Ophn-1+/y neurons (filled circles). Paired-pulse depression was greater in Ophn-1−/y neurons. Ba, representative traces illustrating IPSC summation in response to 10 stimuli delivered at 50 Hz. The responses to 1st stimuli were normalized. Ophn-1−/y IPSCs (grey trace) showed less summation. Bb, IPSC amplitude plotted against stimulus number for 50 Hz trains in Ophn-1+/y (filled circles, n = 11) and Ophn-1-/y neurons (open circles, n = 9). Bc, maximal IPSC amplitude (mean of the last 5 stimuli) plotted against stimulus frequency (same cells as Ba).
Figure 7
Figure 7. Application of hypertonic sucrose reveals a smaller readily releasable pool in Ophn-1−/y neurons
A, representative traces of responses to sucrose solution from Ophn-1+/y (upper panel) and Ophn-1-/y neurons (lower panel). Under normal conditions (left panel) spontaneous IPSCs were observed, but at a lower frequency in Ophn-1-/y neurons. Application of sucrose (5 s) to the dendrites of granule cells increased the frequency of spontaneous IPSCs and increased holding current (centre panel), which reversed on wash (right panel). B, RRP size was estimated from the charge transfer in response to sucrose divided by the mean charge of miniature IPSCs recorded in the presence of 1 μm TTX. RRP is smaller in Ophn-1-/y neurons (open bars). *P < 0.05.
Figure 8
Figure 8. Smaller RRP and altered vesicle recruitment in Ophn-1−/y neurons
Averaged trains of evoked IPSCs recorded during a 20 Hz train of stimuli in an Ophn-1+/y (Aa, upper trace) and Ophn-1-/y neuron (lower trace). The traces are averages of 5 sweeps. Ab, the corresponding cumulative eIPSC amplitude plot (Ophn-1+/y, filled circles; Ophn-1-/y, open circles). Data between 1 and 2 s were fitted by linear regression and back-extrapolated to time 0 to estimate the RRP size (Ab and Ba). Ba, the mean amplitude of IPSC1 was unaltered in Ophn-1-/y neurons. Bb, mean Pves was increased in Ophn-1-/y neurons, whilst the mean number of vesicles forming the RRPsyn was reduced (Bc). Ca, protocol for assessing vesicle recycling. The readily releasable pool was depleted by 40 minimal stimuli at 20 Hz; after depletion, RRP replenishment was assessed by a further stimulus (IPSCR), Δt seconds after the stimulus train. Vesicle recruitment (IPSCR normalised to IPSC1, Cb) is reduced in Ophn-1-/y neurons. *P < 0.05, **P < 0.01, ***P < 0.001.
Figure 9
Figure 9. ROCK inhibitor, Y-27632, reversed the synaptic deficits in Ophn-1-/y neurons
Y-27632 reversed: the reduced sIPSC frequency (A), eIPSC amplitude (B), RRP size (C) and vesicle availability (D), in Ophn-1-/y neurons (light grey traces and columns). Y-27632 did not affect Ophn-1+/y responses (dark grey columns). Y-27632 (10 μm) was applied 10–20 min before whole cell recording and applied continually throughout the recording. *P < 0.05, ***P < 0.001.

Comment in

References

    1. Ashton AC, Ushkaryov YA. Properties of synaptic vesicle pools in mature central nerve terminals. J Biol Chem. 2005;280:37278–37288. - PubMed
    1. Bartos M, Vida I, Jonas P. Synaptic mechanisms of synchronized gamma oscillations in inhibitory interneuron networks. Nat Rev Neurosci. 2007;8:45–56. - PubMed
    1. Bekkers JM, Hausser M. Targeted dendrotomy reveals active and passive contributions of the dendritic tree to synaptic integration and neuronal output. Proc Natl Acad Sci U S A. 2007;104:11447–11452. - PMC - PubMed
    1. Billuart P, Bienvenu T, Ronce N, des Portes V, Vinet MC, Zemni R, Roest CH, Carrie A, Fauchereau F, Cherry M, Briault S, Hamel B, Fryns JP, Beldjord C, Kahn A, Moraine C, Chelly J. Oligophrenin-1 encodes a RhoGAP protein involved in X-linked mental retardation. Nature. 1998;392:923–926. - PubMed
    1. Chelly J, Khelfaoui M, Francis F, Cherif B, Bienvenu T. Genetics and pathophysiology of mental retardation. Eur J Hum Genet. 2006;14:701–713. - PubMed

Publication types

MeSH terms

LinkOut - more resources