. 2011 Dec;21(12):1670-6.
doi: 10.1038/cr.2011.189. Epub 2011 Nov 29.

Generation and replication-dependent dilution of 5fC and 5caC during mouse preimplantation development

Affiliations

Generation and replication-dependent dilution of 5fC and 5caC during mouse preimplantation development

Azusa Inoue et al. Cell Res. 2011 Dec.

Abstract

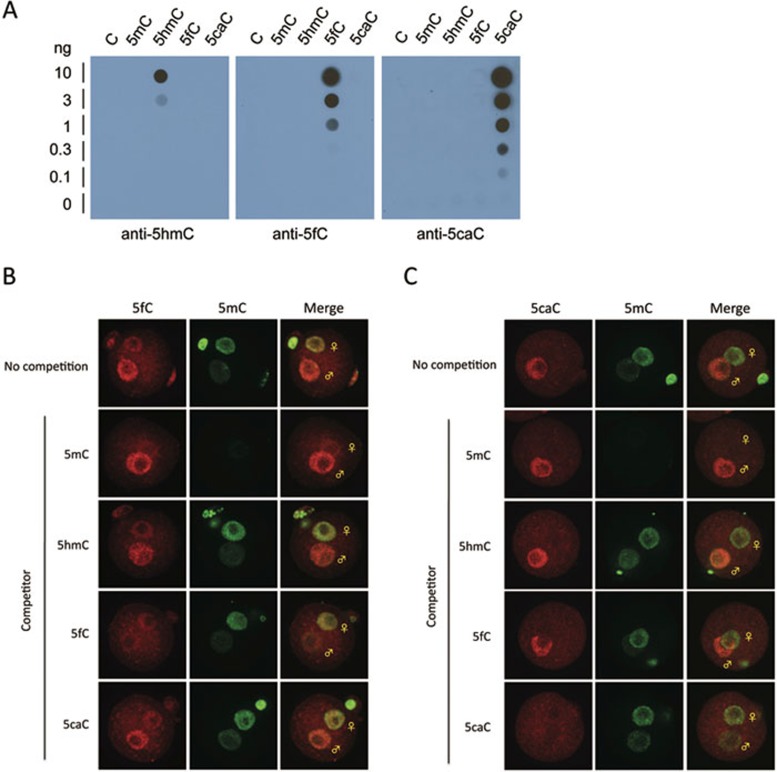
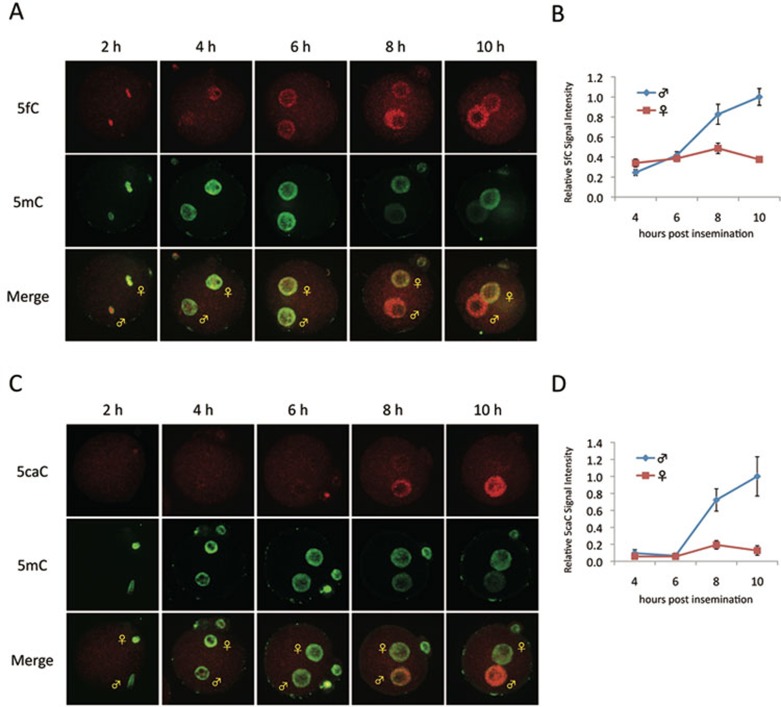
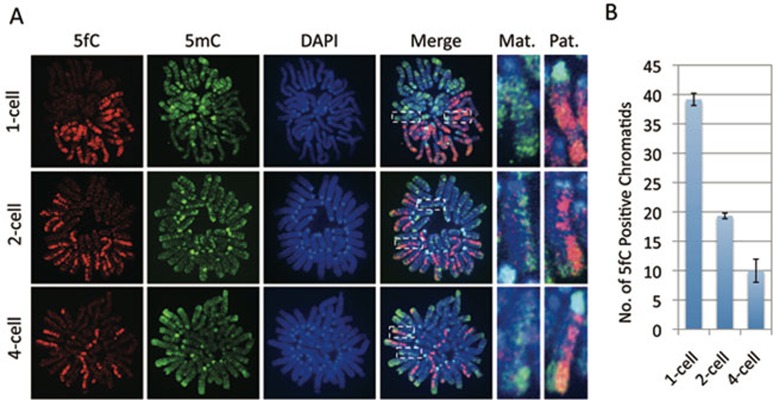
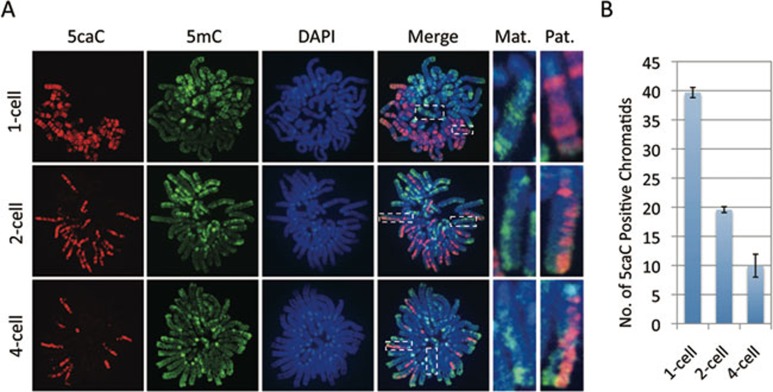
One of the recent advances in the epigenetic field is the demonstration that the Tet family of proteins are capable of catalyzing conversion of 5-methylcytosine (5mC) of DNA to 5-hydroxymethylcytosine (5hmC). Interestingly, recent studies have shown that 5hmC can be further oxidized by Tet proteins to generate 5-formylcytosine (5fC) and 5-carboxylcytosine (5caC), which can be removed by thymine DNA glycosylase (TDG). To determine whether Tet-catalyzed conversion of 5mC to 5fC and 5caC occurs in vivo in zygotes, we generated antibodies specific for 5fC and 5caC. By immunostaining, we demonstrate that loss of 5mC in the paternal pronucleus is concurrent with the appearance of 5fC and 5caC, similar to that of 5hmC. Importantly, instead of being quickly removed through an enzyme-catalyzed process, both 5fC and 5caC exhibit replication-dependent dilution during mouse preimplantation development. These results not only demonstrate the conversion of 5mC to 5fC and 5caC in zygotes, but also indicate that both 5fC and 5caC are relatively stable and may be functional during preimplantation development. Together with previous studies, our study suggests that Tet-catalyzed conversion of 5mC to 5hmC/5fC/5caC followed by replication-dependent dilution accounts for paternal DNA demethylation during preimplantation development.


Figures

Figure 1
Figure 1
Characterization of 5fC and 5caC antibody specificity. (A) The 5fC and 5caC antibodies recognize 5fC and 5caC-containing oligo DNA in dot-blot assays. Different amounts of 38-mer DNA oligos where C are either C, 5mC, 5hmC, 5fC, and 5caC were spotted on membrane and were probed with 5hmC (Active Motif), 5fC, and 5caC antibodies, respectively. (B, C) Representative confocal microscopy images of zygotes co-stained with 5mC and 5fC (B) or 5caC (C) antibodies in the absence or presence of 2 μM of competitive nucleosides indicated.
Figure 2
Figure 2
Loss of 5mC staining in the paternal pronucleus correlates with increase in 5fC and 5caC staining in zygotes. (A, C) Representative confocal microscopy images of mouse zygotes co-stained with 5mC (green), 5fC (A) or 5caC (C) (red) at different times post-insemination. The intensity of 5mC and 5fC is similar in male and female pronuclei until 6 h post-insemination (hpi). Concomitant with the decrease in the 5mC intensity in male pronuclei, the intensity of 5fC increases between 8-10 hpi (A). In terms of 5caC, very little is detected before 6 hpi. Its accumulation in the male pronucleus correlates with the decrease of 5mC (C). (B, D) Quantification of the relative levels of 5fC (B) and 5caC (D) in male and female pronuclei at different times post-insemination. The signal intensity is quantified using AxioVision software. The signal intensity in the paternal pronucleus at 10 hpi is set as 1.0. The experiments were repeated for three times and 15-25 zygotes were quantified for each stage. Bars represent standard errors.
Figure 3
Figure 3
Replication-dependent loss of 5fC during mouse preimplantation development. (A) Representative images of mitotic chromosome spreads co-stained with 5fC (red), 5mC (green) antibodies or DAPI (blue) at 1-cell, 2-cell, and 4-cell stages as indicated. Shown are the images of chromosomes from one blastomere at each developmental stage. Note that 5fC is present in both chromatids of the sperm-derived chromosomes at 1-cell stage embryos. However, only one of the two chromatids of the sperm-derived chromosomes stained positively for 5fC at the 2-cell stage, and only about a quarter of the sister chromatids stained positively for 5fC at the 4-cell stage. The dotted squares represent the enlarged paternal (Pat.) or maternal (Mat.) chromosomes, respectively. (B) Quantification of the total numbers of 5fC positive chromatids in each blastomere. When partial regions of the chromatids were positively stained due to sister chromatid exchange, the total length of 5fC-enriched chromatid segments in each blastomere was determined and calculated in terms of the number of chromosome equivalent. The experiments were repeated for four times and the total number of blastomeres examined at the 1-cell, 2-cell, and 4-cell stages were 12, 22, and 19, respectively. Bars represent standard deviation.
Figure 4
Figure 4
Replication-dependent loss of 5caC during mouse preimplantation development. (A) Representative images of mitotic chromosome spreads co-stained with 5caC (red), 5mC (green) antibodies or DAPI (blue) at 1-cell, 2-cell, and 4-cell stages as indicated. Shown are the images of chromosomes from one blastomere at each developmental stage. Note that 5caC is present in both chromatids of the sperm-derived chromosomes at 1-cell stage embryos. However, only one of the two chromatids of the sperm-derived chromosomes stained positively for 5caC at the 2-cell stage, and only about a quarter of the sister chromatids stained positively for 5caC at the 4-cell stage. The dotted squares represent the enlarged paternal (Pat.) or maternal (Mat.) chromosomes, respectively. (B) Quantification of the total numbers of 5caC positive chromatids in each blastomere. The quantification method is the same as that described in Figure 3B. The experiments were repeated for four times and the total number of blastomeres examined at the 1-cell, 2-cell, and 4-cell stages were 19, 24, and 27, respectively. Bars represent standard deviation.

Comment in

References

    1. Cedar H, Bergman Y. Linking DNA methylation and histone modification: patterns and paradigms. Nat Rev Genet. 2009;10:295–304. - PubMed
    1. Sasaki H, Matsui Y. Epigenetic events in mammalian germ-cell development: reprogramming and beyond. Nat Rev Genet. 2008;9:129–140. - PubMed
    1. Suzuki MM, Bird A. DNA methylation landscapes: provocative insights from epigenomics. Nat Rev Genet. 2008;9:465–476. - PubMed
    1. Goll MG, Bestor TH. Eukaryotic cytosine methyltransferases. Annu Rev Biochem. 2005;74:481–514. - PubMed
    1. Wu SC, Zhang Y. Active DNA demethylation: many roads lead to Rome. Nat Rev Mol Cell Biol. 2010;11:607–620. - PMC - PubMed

Publication types