. 2012 Oct;17(10):1017-25.
doi: 10.1038/mp.2011.160. Epub 2011 Nov 29.

Cocaine-induced cortical microischemia in the rodent brain: clinical implications

Affiliations

Cocaine-induced cortical microischemia in the rodent brain: clinical implications

H Ren et al. Mol Psychiatry. 2012 Oct.

Abstract

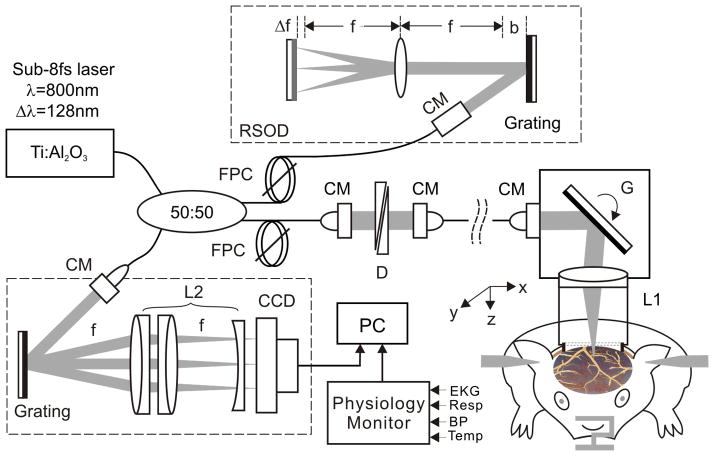
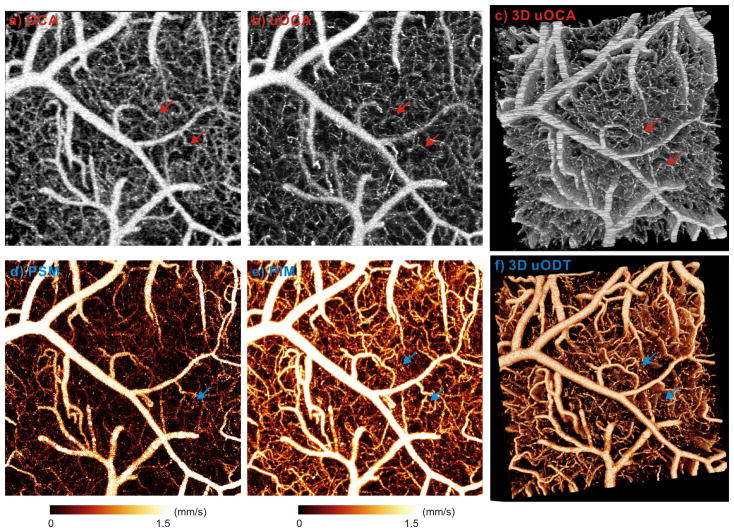
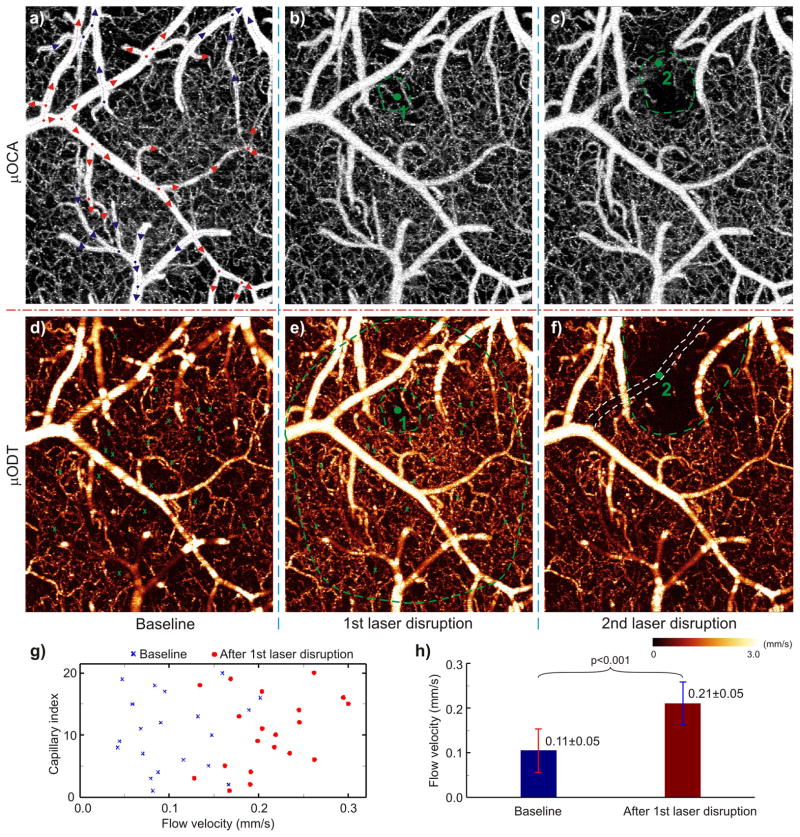
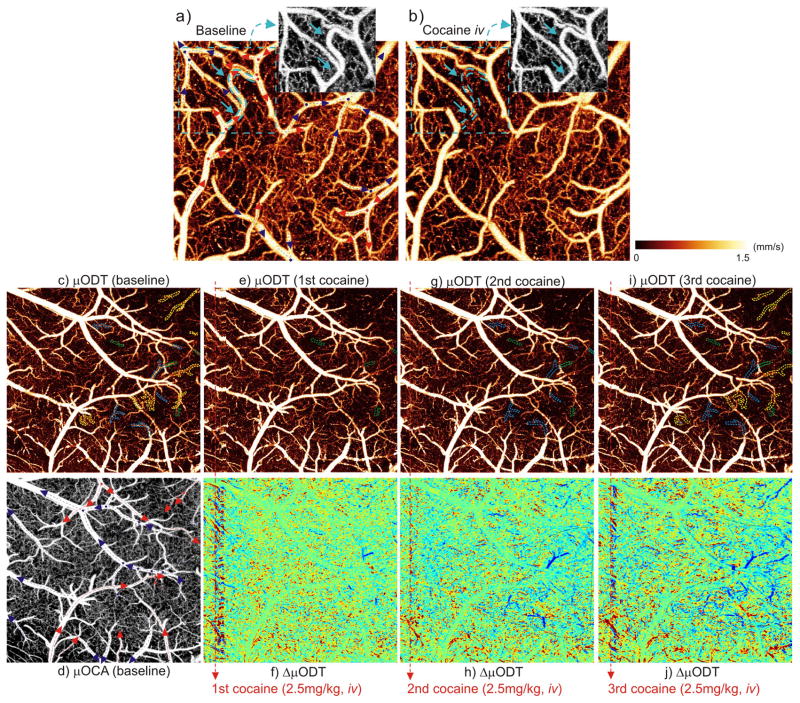
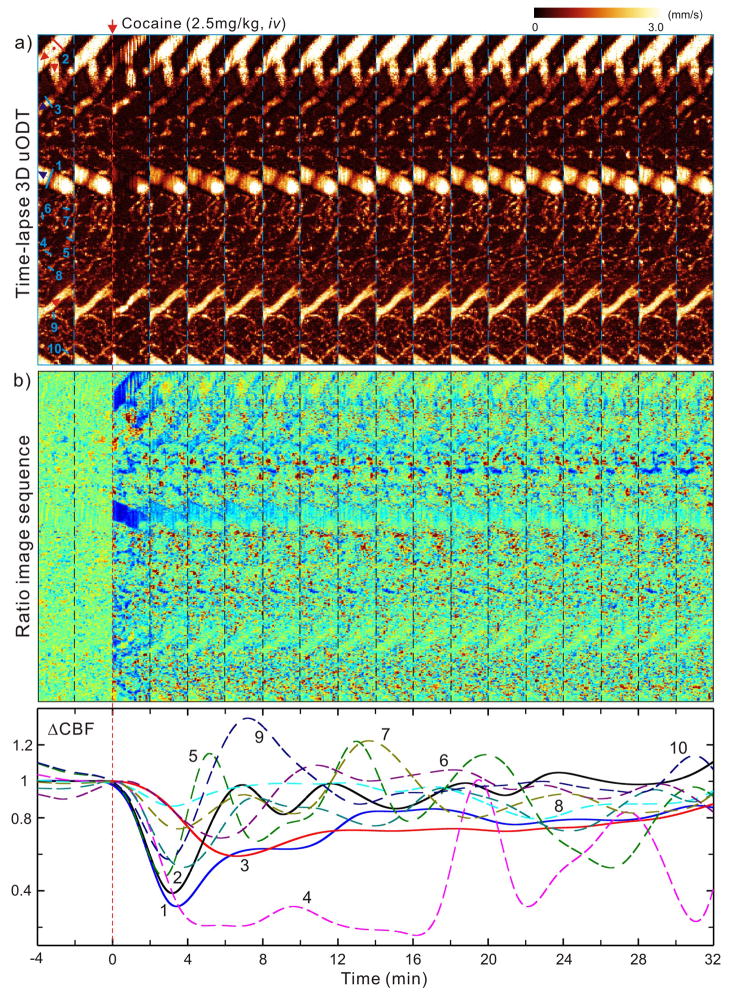
Cocaine-induced stroke is among the most serious medical complications associated with its abuse. However, the extent to which acute cocaine may induce silent microischemia predisposing the cerebral tissue to neurotoxicity has not been investigated; in part, because of limitations of current neuroimaging tools, that is, lack of high spatiotemporal resolution and sensitivity to simultaneously measure cerebral blood flow (CBF) in vessels of different calibers (including capillaries) quantitatively and over a large field of view. Here we combine ultrahigh-resolution optical coherence tomography to enable tracker-free three-dimensional (3D) microvascular angiography and a new phase-intensity-mapping algorithm to enhance the sensitivity of 3D optical Doppler tomography for simultaneous capillary CBF quantization. We apply the technique to study the responses of cerebral microvascular networks to single and repeated cocaine administration in the mouse somatosensory cortex. We show that within 2-3 min after cocaine administration CBF markedly decreased (for example, ~70%), but the magnitude and recovery differed for the various types of vessels; arterioles had the fastest recovery (~5 min), capillaries varied drastically (from 4-20 min) and venules showed relatively slower recovery (~12 min). More importantly, we showed that cocaine interrupted CBF in some arteriolar branches for over 45 min and this effect was exacerbated with repeated cocaine administration. These results provide evidence that cocaine doses within the range administered by drug abusers induces cerebral microischemia and that these effects are exacerbated with repeated use. Thus, cocaine-induced microischemia is likely to be a contributor to its neurotoxic effects.


Conflict of interest statement

CONFLICT OF INTEREST

The authors declare no conflict of interest.

Figures

Fig. 1
Fig. 1
A schematic of μOCT for simultaneous 3D μOCA/μODT imaging of mouse cortical cerebrovascular networks in vivo. CM: fiberoptic collimator, FPC: fiber polarization controller; D: paired wedge prisms; RSOD: grating-lens-based rapid optical delay (f: focal length, Δf: spectral modification to maximize Δλcp, b: dispersion compensation along with D); G: servo mirror; Obj: achromatic lens (f16mm/NA0.25); L1, L2: achromatic lens group for field correction.
Fig. 2
Fig. 2
Cerebral vasculature (upper panel) and CBF (lower panel) of mouse somatosensory cortex imaged by 3D μOCA/μODT. a)–b) Maximum intensity projection (MIP) images of vasculature by OCA (~12μm) and by μOCA (~3μm). Capillaries that appear largely identical (~ϕ15μm) in OCA are fully restored to their real sizes (e.g., ϕ3.5μm) by μOCA. c) 3D μOCA image. d)–e) The corresponding MIP images of quantitative CBF by existing PSM vs. new PIM algorithms. PIM effectively enhanced flow detection sensitivity to uncover capillary CBF embedded in the noise background. f) 3D μODT image. Image size (FOV): 1×1×1mm3. Arrows: 2 capillaries (ϕ5.4μm, ϕ3.5μm) for comparison.
Fig. 3
Fig. 3
Laser disruptions of a cerebral capillary (1) and a branch vessel (2) on mouse cortex. Upper panel: MIP images of microvasculature (μOCA) at baseline (a), after laser disruption of a ϕ9μm capillary (b), and of a ϕ35.8μm arteriole (c). Red/blue arrows: flow directions of arterioles/venules, dots: vessel junctures. Lower panel: MIP images of CBF (μODT) at baseline (d) and after laser disruptions (e, f). Angiography detects no difference except reduced vasculature in the immediate areas (dashed green circles in b, c) around laser disruption (green dots); whereas quantitative CBF reveals vastly expanded vasodilatation almost over the entire field after laser disruption of a capillary (dashed outer green circle in e) and the quenching of local CBF networks over a much larger area (dashed green circle in e). Quantitative comparisons among 20 capillaries indicate that CBF increased significantly from 0.105±0.049mm/s at baseline to 0.211±0.048mm/s at 30min after laser disruption (g and h; p<0.001). Image size: 1×1.2×1mm3. Laser radiation: 532nm/60mW, ~ϕ3μm focal spot; 2min and 6min exposures for capillary (1) and arteriole (2), respectively.
Fig. 4
Fig. 4
Cocaine-evoked microvascular disruptions on the mouse somatosensory cortex. Upper panel: quantitative CBF (μODT) to show disruption of a ~ϕ23μm arteriole (arcade); low panels: progression of cocaine-evoked deactivations of branch vessels and spreading of vasoconstriction (dark dashed areas) with repeated cocaine challenges. a) baseline, b) 30min after cocaine injection (2.5mg/kg, i.v.); insets: vasculature (μOCA) of the dashed area. Image size: 1×1×1mm3. c–d) μODT/μOCA at baseline, e–j) μODT and ΔμODT after 1–3 cocaine doses (green/blue/yellow dashed circles: occluded vessels after 1–3 cocaine doses; dark circles: vasoconstrictive clouds). Image size: 2×2×1mm3. Red/blue arrows: flow directions of arteriolar/venial vessels; dots: vessel junctures.
Fig. 5
Fig. 5
Spatiotemporal responses of CBF to an acute cocaine challenge (2.5mg/kg, i.v.). a) Time-lapse CBF images (1×0.12×1mm3/panel); b) Normalized ratio images (ΔCBF) with time, showing heterogeneous responses to cocaine; c) time-lapse ΔCBF curves of 3 branch vessels (solid curves) and 7 capillary vessels (dashed curves) whose positions are marked by light green lines in a). CBF in larger branch vessels (1: vein, 2: arteriole) show a dramatic transient drop (~60–70%) within 2–3min followed by a slow recovery, similar responses are seen in venule (3) except the dip is smaller (~40%) and lagged to 6–7min. Noteworthily, arteriole (2) recovers faster (at ~5min) and exhibits more pulsive patterns than the 2 venules (e.g., at ~12min for 1). In contrast, capillaries show dramatically different patterns and more vibrant or pulsive changes with cocaine. Red/blue arrows: flow directions of arterioles/venules; dots: vessel junctures.

References

    1. Volkow ND, Mullani N, Gould KL, Adler S, Krajewski K. Cerebral blood flow in chronic cocaine users: a study with positron emission tomography. The British Journal of Psychiatry. 1988;152(5):641. - PubMed
    1. Howington JU, Kutz SC, Wilding GE, Awasthi D. Cocaine use as a predictor of outcome in aneurysmal subarachnoid hemorrhage. Journal of neurosurgery. 2003;99 (2):271–275. - PubMed
    1. Pozzi M, Roccatagliata D, Sterzi R. Drug abuse and intracranial hemorrhage. Neurological Sciences. 2008;29:269–270. - PubMed
    1. Bartzokis G, Beckson M, Hance DB, Lu PH, Foster JA, Mintz J, et al. Magnetic resonance imaging evidence of “silent” cerebrovascular toxicity in cocaine dependence. Biological psychiatry. 1999;45(9):1203–1211. - PubMed
    1. Toossi S, Hess CP, Hills NK, Josephson SA. Neurovascular Complications of Cocaine Use at a Tertiary Stroke Center. Journal of Stroke and Cerebrovascular Diseases. 2010;19(4):273–278. - PubMed

Publication types

MeSH terms