. 2012 Feb 1;31(3):692-706.
doi: 10.1038/emboj.2011.435. Epub 2011 Nov 29.

The NF-κB1 transcription factor prevents the intrathymic development of CD8 T cells with memory properties

Affiliations

The NF-κB1 transcription factor prevents the intrathymic development of CD8 T cells with memory properties

Raffi Gugasyan et al. EMBO J. .

Abstract

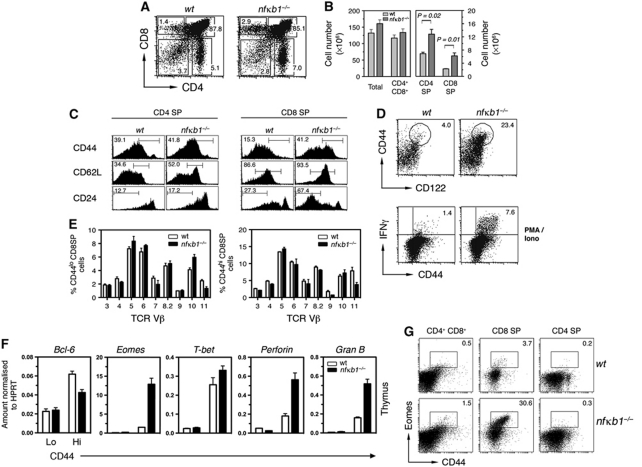
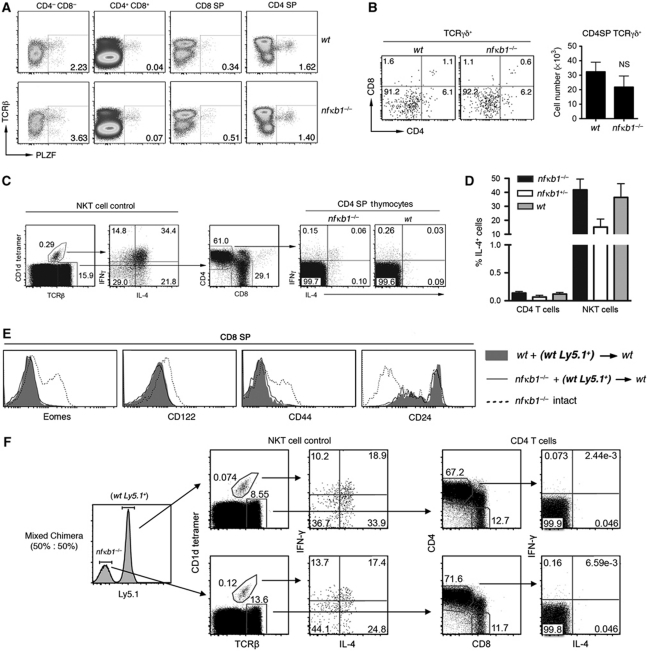
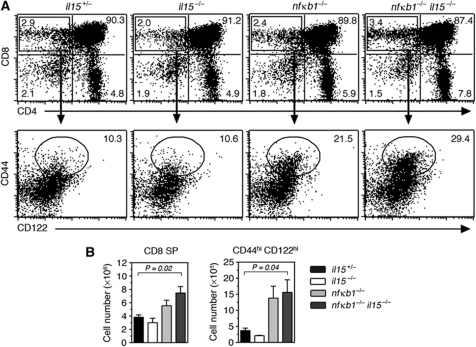
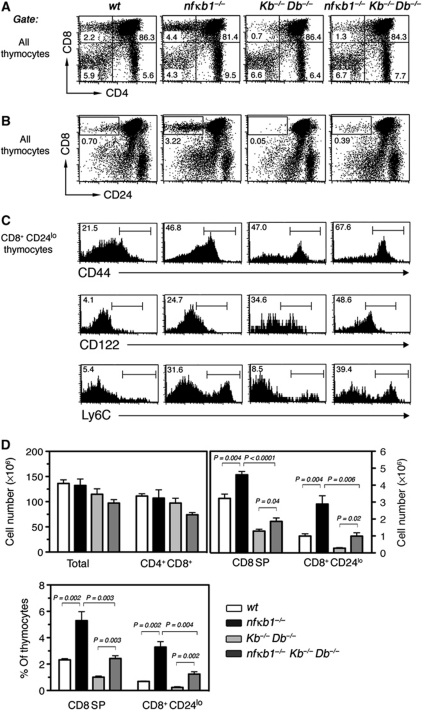
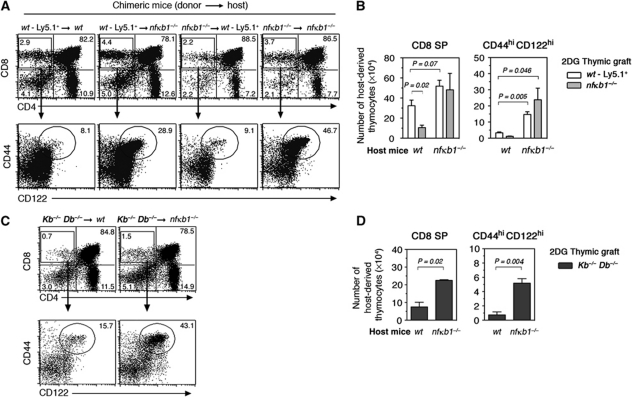
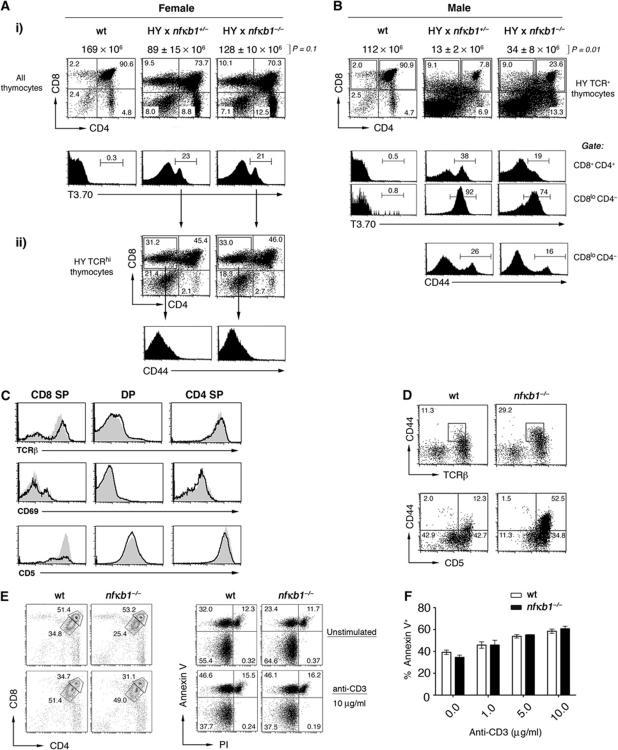
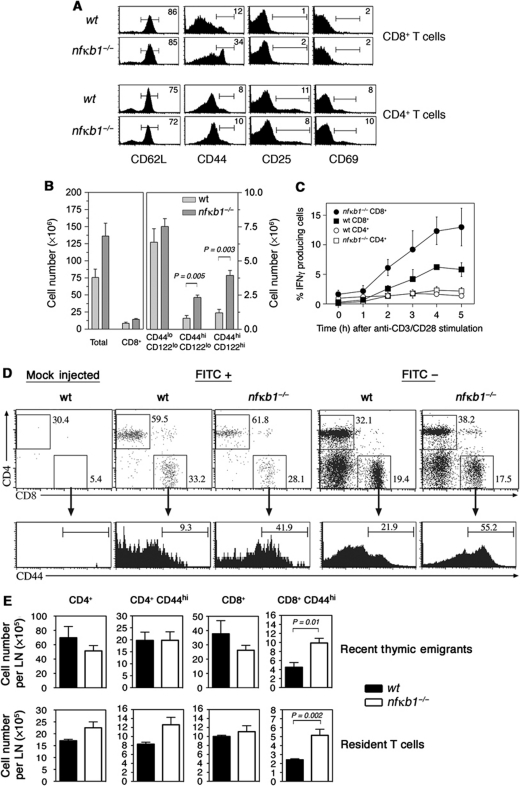
The role of specific members of the NF-κB family of transcription factors in CD8 T-cell selection and development is largely unknown. Here, we show that mice lacking NF-κB1 develop a unique population of conventional CD8 single-positive (SP) thymocytes with memory T cell-like properties that populate peripheral immune organs. Development of this memory-like population is not due to PLZF(+) thymocytes and instead coincides with changes in CD8 T-cell selection. These include a reduction in the efficiency of negative selection and a dependence on MHC class Ia or Ib expressed by haematopoietic cells. These findings indicate that NF-κB1 regulates multiple events in the thymus that collectively inhibit the excess development of CD8(+) thymocytes with memory cell characteristics.


Conflict of interest statement

The authors declare that they have no conflict of interest.

Figures

Figure 1
Figure 1
nfκb1−/− CD8SP thymocytes display memory characteristics. (A) CD4 and CD8 expression by thymocytes from 8-week-old wt and nfκb1−/− mice with numbers showing percentages of cells in each gate. (B) Mean (±s.e.m.) numbers of thymocyte subsets in wt and nfκb1−/− mice. Data consist of one cohort (n=3 mice per genotype). (C) Phenotype of wt and nfκb1−/− CD4 and CD8 SP thymocytes (n=7 mice per genotype). (D) Expression of CD44 and CD122 by wt and nfκb1−/− CD8SP thymocytes. Values indicate percentages of CD44hiCD122hi cells and data represent seven mice per genotype. IFN-γ and CD44 expression gated on wt and nfκb1−/− CD8SP thymocytes after 5 h of stimulation with PMA (10 ng/ml) plus ionomycin (1 μg/ml) (n=6 mice per genotype). (E) Proportion of Vβ TCRs (x axis) gated on CD8SP CD44lo or CD44hi thymocytes for wt and nfκb1−/− mice (mean±s.e.m.; n=3 per genotype). (F) Relative expression of Bcl-6, Eomes, T-bet, Perforin and Granzyme B mRNA in wt and nfκb1−/− CD44lo and CD44hi CD8SP thymocytes (cells were purified from four mice per genotype for each experiment). Graphs show mean±s.d. from triplicate reactions. (G) Expression of Eomes and CD44 by wt and nfκb1−/− thymocyte subsets (n=4 mice per genotype). Values indicate percentages of cells in each gate. Data shown are representative of seven (A), five (B), four (C, G), three (D) and two (E, F) independent experiments. P-values were determined by an unpaired two-tailed Student's t-test.
Figure 2
Figure 2
nfκb1−/− CD8SP thymocytes acquire memory markers independently of the IL-4 producing PLZF+ population. (A) Expression of PLZF in wt and nfκb1−/− thymocyte subsets. Data represent four mice per genotype. (B) CD4 and CD8 expression by wt and nfκb1−/− TCRγδ+ thymocytes. Mean (±s.e.m.) numbers of wt and nfκb1−/− TCRγδ+CD4SP thymocytes, determined by total numbers of TCRγδ+ thymocytes and proportion of TCRγδ+CD4SP cells (n=3–4 mice per genotype). (C) Expression of IL-4 and IFN-γ in wt, nfκb1+/− and nfκb1−/− thymocytes 2 h after stimulation with PMA plus ionomycin. NKT cells (CD1d tetramer+ TCRβ+) stained with CD1d tetramer loaded with PBS-44 were analysed as an internal positive control for IL-4 and IFN-γ (left panel). CD4SP thymocytes gated on TCRβ+ cells were examined for IL-4 and IFN-γ (right panel). (D) Percentages (mean±s.e.m.) of IL-4-producing CD4 T cells and NKT cells from thymuses of wt (n=4), nfκb1+/− (n=2) and nfκb1−/− (n=7) mice. Results are representative of three (B) and four (A, C, D) experiments. (E) Expression of Eomes, CD122, CD44 and CD24 by wt (Ly5.1+) CD8SP thymocytes (bold) isolated from wt+ (wt Ly5.1+) (shaded histograms) or nfκb1−/− + (wt Ly5.1+) (black lines) chimera mice. Memory phenotype of nfκb1−/− CD8SP cells from intact nfκb1−/− mice (hatched lines) served as concurrent positive control. Data are representative of three different chimera cohorts (n>6 mice per group). BM chimera mice were established by engrafting wt (Ly5.2+) hosts with a mix (50:50) of nfκb1−/− and wt (Ly5.1+) haematopoietic cells. (F) NKT cells (CD1d tetramer+ TCRβ+) and CD4 T cells (TCRβ+CD4+CD8) were assessed for IL-4 and IFNγ expression. Thymocytes were isolated from chimeras and stimulated in vitro with PMA and ionomycin for 2 h and then analysed for intracellular levels of IL-4 and IFN-γ by flow cytometry. Wt and nfκb1−/− thymocytes were defined as Ly5.1+ and Ly5.1, respectively (left panel).
Figure 3
Figure 3
nfκb1−/−CD8SP thymocytes acquire memory markers independently of IL-15. (A) CD4 and CD8 expression by thymocytes from 8-week-old il15+/−, il15−/−, nfκb1−/− and nfkb1−/− il15−/− mice. Values represent percentages of cells in each quadrant. Expression of CD44 and CD122 by CD8SP thymocytes (lower dot plots) with numbers representing the percentages CD44hiCD122hi CD8SP cells. (B) Mean±s.e.m. (n=6 mice per genotype) number of CD8SP and CD44hiCD122hi CD8SP thymocytes. Data are representative of five experiments. P-values were determined by an unpaired two-tailed Student's t-test.
Figure 4
Figure 4
Loss of NF-κB1 promotes memory marker acquisition independently of MHC class Ia. (A) CD4 and CD8 profiles for wt, nfκb1−/−, Kb−/−Db−/− and nfκb1−/−Kb−/−Db−/− thymocytes. Numbers indicate the percent of thymocytes in each quadrant. (B) CD8 and CD24 expression by thymocytes from each genotype. Numbers represent percentages of CD8+CD24lo cells in each gate. (C) CD44, CD122 and Ly6C expression by CD8+CD24lo thymocytes. Percentages are shown for each gate. (D) Absolute numbers (mean±s.e.m.) of total thymocytes, DP, CD8SP and CD8+CD24lo thymocytes for each genotype; Lower graph shows percentages of CD8SP and CD8+CD24lo thymocytes (mean±s.e.m.). Data in (AD) are representative of four experiments (4–6 mice per genotype). P-values were determined by an unpaired two-tailed Student's t-test.
Figure 5
Figure 5
nfκb1−/− CD8SP thymocytes acquire a memory phenotype independently of MHC class I expressing TECs. Thymic lobes were harvested from wt (Ly5.1+), nfκb1−/− (Ly5.2+) and Kb−/−Db−/− day 15.5 embryos and cultured by FTOC in the presence of 2-DG for depletion of endogenous thymocytes. After 7 days in culture, 2-DG-treated thymi were transplanted under the renal capsule of wt and nfκb1−/− hosts. Grafts were harvested and processed for immunofluorescent staining and cell counting 8 weeks post transplant. (A) CD4 and CD8 expression by host-derived thymocytes isolated from thymic grafts. Values represent percentages of each thymocyte subset. CD44 and CD122 expression by CD8SP thymocytes and numbers indicate the percentage of CD44hiCD122hi CD8SP cells. (B) Absolute numbers (mean±s.e.m.) of host-derived CD8SP and CD144hiCD122hi CD8SP thymocytes from 3 to 5 transplanted thymi per host. (C) CD4 and CD8 profiles of host-derived thymocytes from Kb−/−Db−/− thymi grafted into wt or nfκb1−/− mice. CD44 and CD122 phenotype of host CD8SP thymocytes isolated from Kb−/−Db−/− grafts. (D) Absolute numbers (mean±s.e.m.; n=4 grafts per host) of CD8SP and CD144hiCD122hi CD8SP thymocytes isolated from Kb−/−Db−/− grafts. Data in (AD) are representative of two independent experiments. P-values were determined by an unpaired two-tailed Student's t-test.
Figure 6
Figure 6
Reduced negative selection in HY TCR transgenic nfκb1−/− mice. (A) Expression of CD4 and CD8 by thymocytes from female (gate: all thymocytes) and (B) male (gate: HY+ TCR) nfκb1+/− and nfκb1−/− HY TCR transgenic mice. Values indicate percentages of cells in each quadrant. Expression of HY TCR (T3.70) is shown for all thymocytes (Ai) or individual thymocyte subsets (B). Wt thymocytes were stained concurrently with T3.70 as a staining control. Values in histograms represent percentages of HY TCRhi thymocytes in gated areas. (Aii) CD4 and CD8 profiles by HY TCRhi thymocytes in female transgenic mice. Total thymocyte cellularity is shown for each genotype (above dot plots; mean±s.e.m.). P-values were determined by an unpaired two-tailed Student's t-test. (Aii, B) CD44 expression by HY TCRhiCD8SP thymocytes. Data in (A) and (B) are representative four experiments (n>4 mice per genotype). (C) Phenotype of wt (black lines) and nfκb1−/− (grey shaded) thymocyte subsets for TCRβ, CD69 and CD5 expression. (D) Analysis of CD44 in combination with TCRβ or CD5 gated on wt and nfκb1−/− CD8SP thymocytes. Data in (C) and (D) are representative of three experiments (n=5 mice per genotype). (E) CD4 and CD8 expression of wt and nfκb1−/− thymocytes 24 h after in-vitro stimulation with anti-CD3 Ab (μg/ml). Values indicate percentages of cells expressing high or low levels of CD4 and CD8. Annexin V and PI staining of wt and nfκb1−/− thymocytes at the corresponding time point. (F) Percentages of Annexin V+ cells (mean±s.e.m.) for wt and nfκb1−/− thymocytes cultured for 24 h at the indicated concentrations of anti-CD3 (μg/ml) Ab or media alone (>95% of wt and nfκb1−/− thymocytes were viable at T0). Data in (E) and (F) are from three experiments.
Figure 7
Figure 7
Decreased numbers of Sirpαhi DCs in the thymus of nfκb1−/− mice. Comparison of DC numbers (conventional, Sirpαhi and Sirpαlo) from the thymus of wt and nfκb1−/− mice. DCs were analysed on four pooled thymi per genotype, staining for CD11c, Sirpα and CD45R: cDCs were gated as CD11chiCD45 cells and analysed for Sirpα expression. Data show two independent experiments using a total of eight mice per genotype.
Figure 8
Figure 8
Thymic memory-like CD8+ T cells populate the periphery of nfκb1−/− mice. (A) Phenotype of wt and nfκb1−/− CD4+ and CD8+ splenic T cells. Values indicate percentages of cells in gated areas. Data represent at least nine mice per genotype. (B) Mean (±s.e.m.) numbers of total splenocytes, CD8+ T cells, naive (CD44loCD122lo) and memory-like (CD44hiCD122lo and CD44hiCD122hi) CD8+ T cells. Expression of CD44 and CD122 by wt and nfκb1−/− splenic CD8+ T cells is shown in Supplementary Figure S3E. Data in (A) and (B) are representative of three experiments (n>9 mice per genotype). (C) Percentages of IFN-γ producing T cells from wt and nfκb1−/− mice. Splenocytes were stimulated with plate-bound anti-CD3/anti-CD28 Abs (both 10 μg/ml) and stained for IFN-γ, CD4 and CD8 expression. Stains were performed on duplicate samples every hour and sample flow profiles shown in Supplementary Figure S3E. Data are representative of two independent experiments. (D) Memory-like CD8+ T cells home to the periphery of nfκb1−/− mice. Wt and nfκb1−/− mice were injected intrathymically with FITC or PBS (mock injected). After 20 h, mice were euthanised and mesenteric lymph nodes harvested and processed for immunofluorescent staining. FITC+ (Recent Thymic Emigrants) and FITC (Resident) T cells were examined for CD4 and CD8 expression. Values indicate percentages of cells in each gated region. CD44 expression gated on Recent Thymic Emigrants or Resident CD8+ T cells from wt and nfκb1−/− mice. (E) Absolute numbers of RTE and resident T cells (mean±s.e.m.; n=5 per genotype) calculated from T-cell percentages and total lymph node cell numbers. P-values were determined by an unpaired two-tailed Student's t-test.

Similar articles

Cited by

References

    1. Agus DB, Surh CD, Sprent J (1991) Reentry of T cells to the adult thymus is restricted to activated T cells. J Exp Med 173: 1039–1046 - PMC - PubMed
    1. Atherly LO, Lucas JA, Felices M, Yin CC, Reiner SL, Berg LJ (2006) The Tec family tyrosine kinases Itk and Rlk regulate the development of conventional CD8+ T cells. Immunity 25: 79–91 - PubMed
    1. Azzam HS, DeJarnette JB, Huang K, Emmons R, Park CS, Sommers CL, El-Khoury D, Shores EW, Love PE (2001) Fine tuning of TCR signaling by CD5. J Immunol 166: 5464–5472 - PubMed
    1. Azzam HS, Grinberg A, Lui K, Shen H, Shores EW, Love PE (1998) CD5 expression is developmentally regulated by T cell receptor (TCR) signals and TCR avidity. J Exp Med 188: 2301–2311 - PMC - PubMed
    1. Baldwin TA, Hogquist KA (2007) Transcriptional analysis of clonal deletion in vivo. J Immunol 179: 837–844 - PubMed

Publication types

MeSH terms