. 2012 Jan;61(1):61-73.
doi: 10.2337/db10-1684. Epub 2011 Nov 28.

Endoplasmic reticulum stress inhibits STAT3-dependent suppression of hepatic gluconeogenesis via dephosphorylation and deacetylation

Affiliations

Endoplasmic reticulum stress inhibits STAT3-dependent suppression of hepatic gluconeogenesis via dephosphorylation and deacetylation

Kumi Kimura et al. Diabetes. 2012 Jan.

Abstract

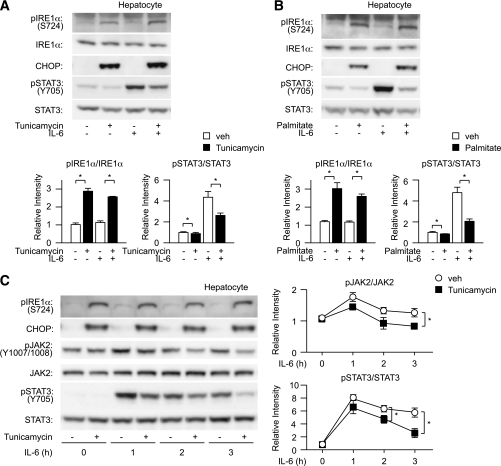
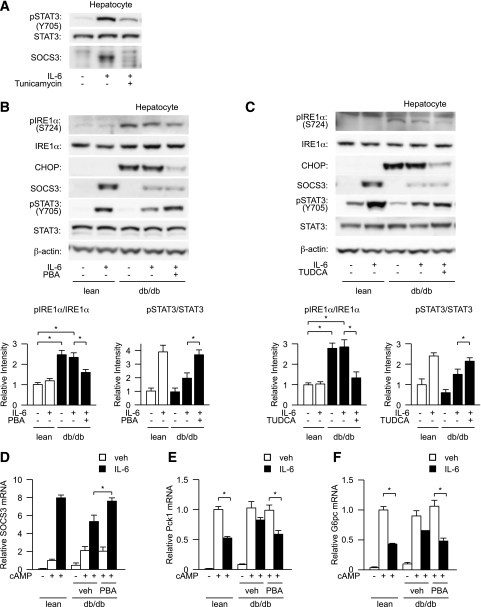
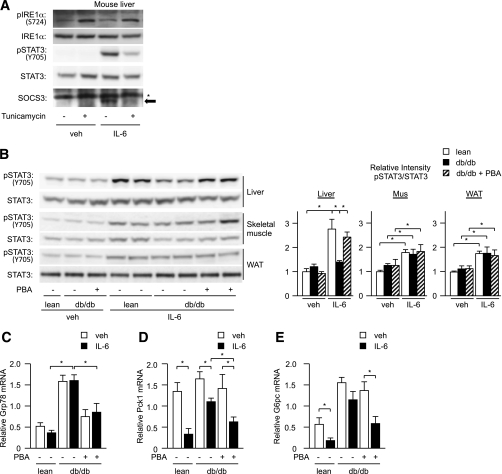
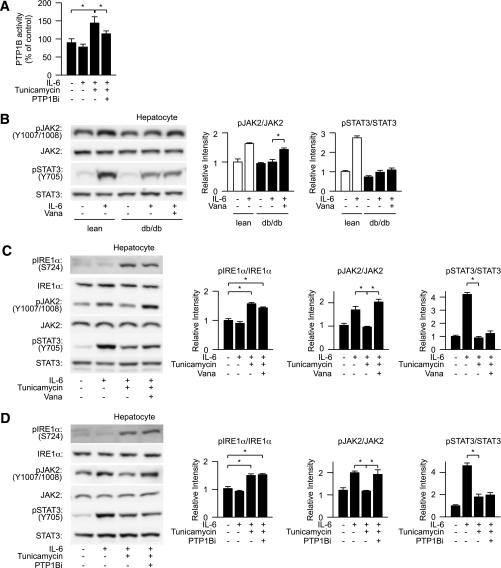
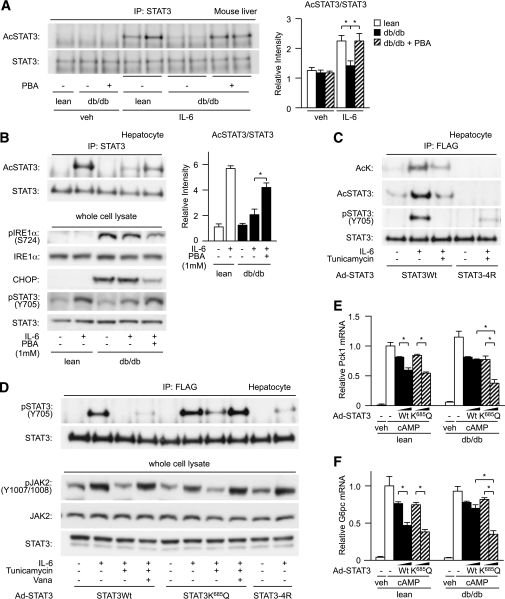
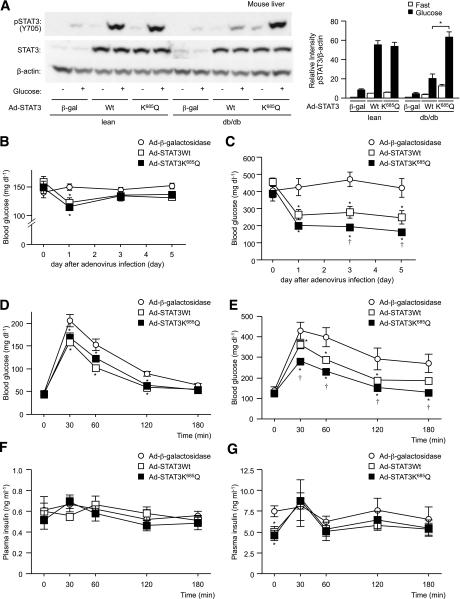
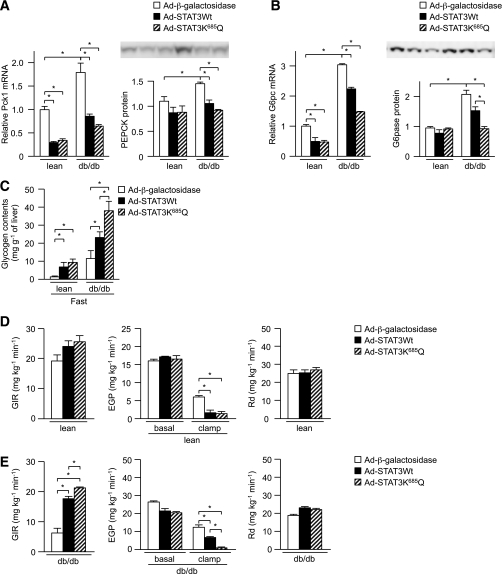
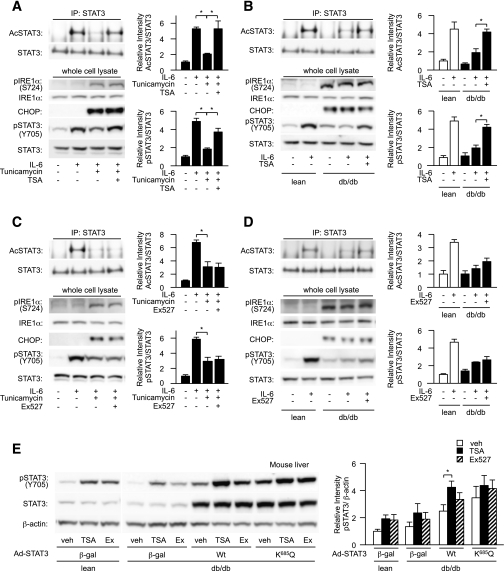
In the liver, signal transducer and activator of transcription 3 (STAT3) plays an important role in the suppression of gluconeogenic enzyme expression. While obesity-associated endoplasmic reticulum (ER) stress has been shown to increase hepatic gluconeogenic enzyme expression, the role of ER stress in STAT3-dependent regulation of such expression is unclear. The current study aimed to elucidate the effect of ER stress on the STAT3-dependent regulation of hepatic gluconeogenic enzyme expression. Genetically obese/diabetic db/db mice and db/db mouse-derived isolated hepatocytes were used as ER stress models. A tyrosine phosphatase inhibitor, a deacetylation inhibitor, and an acetylated mutant of STAT3 were used to examine the effect of ER stress on hepatic STAT3 action. ER stress inhibited STAT3-dependent suppression of gluconeogenic enzyme gene expression by suppressing hepatic Janus kinase (JAK)2 and STAT3 phosphorylation. A tyrosine phosphatase inhibitor restored ER stress-induced suppression of JAK2 phosphorylation but exhibited no improving effect on suppressed STAT3 phosphorylation. STAT3 acetylation is known to correlate with its phosphorylation. ER stress also decreased STAT3 acetylation. An acetylated mutant of STAT3 was resistant to ER stress-induced inhibition of STAT3-phosphorylation and STAT3-dependent suppression of hepatic gluconeogenic enzyme gene expression in vitro and in vivo. Trichostatin A, a histone deacetylase (HDAC) inhibitor, ameliorated ER stress-induced inhibition of STAT3 acetylation and phosphorylation. The current study revealed that ER stress inhibits STAT3-dependent suppression of hepatic gluconeogenic enzymes via JAK2 dephosphorylation and HDAC-dependent STAT3 deacetylation, playing an important role in the increase of hepatic glucose production in obesity and diabetes.


Figures

FIG. 1.
FIG. 1.
Induction of ER stress decreases tyrosine phosphorylation of hepatic STAT3. A and B, top: Wild-type mouse–derived hepatocytes were pretreated with tunicamycin (A) or palmitate (B) followed by stimulation with IL-6 and analyzed for expression of CHOP, phosphorylation of IRE1α, and tyrosine phosphorylation of STAT3. Quantitation of IRE1α and STAT3 phosphorylation levels is normalized to total IRE1α and STAT3 (bottom), respectively, and is represented as mean ± SE. *P < 0.05; open bar, vehicle-treated hepatocytes; closed bar, tunicamycin (A)- or palmitate (B)-treated hepatocytes. C: Wild-type mouse–derived hepatocytes were treated with tunicamycin for 6 h, and cells were stimulated with IL-6 for 1, 2, or 3 h before harvest. Cells were then analyzed for the expression levels of tyrosine phosphorylation of JAK2 and STAT3 (left). Quantitation of JAK2 and STAT3 phosphorylation is normalized to total JAK2 and STAT3, respectively, and is represented as mean ± SE. *P < 0.05 (right); ○, untreated hepatocytes; ■, tunicamycin-treated hepatocytes.
FIG. 2.
FIG. 2.
ER stress impairs activity of hepatic STAT3 in isolated hepatocytes. A: Wild-type mouse–derived hepatocytes were treated with tunicamycin and analyzed for IL-6–stimulated expression of SOCS3 protein. B and C, top: db/db mouse–derived hepatocytes were pretreated with PBA (B) or TUDCA (C) and analyzed for the level of expression of SOCS3 protein, phosphorylation of IRE1α, and tyrosine phosphorylation of STAT3 after stimulation with IL-6. β-Actin was used as a loading control. Quantitation of IRE1α and STAT3 phosphorylation levels is normalized to total IRE1α and STAT3 (bottom), respectively, and is represented as mean ± SE. *P < 0.05; open bar, lean hepatocyte; closed bar, db/db hepatocytes. DF: db/db mouse–derived hepatocytes were pretreated with PBA and analyzed for the induction of SOCS3 mRNA expression (D) and the suppressive effect of IL-6 on cAMP-induced expression of Pck1 mRNA (E) and G6pc mRNA (F) by quantitative RT-PCR. Data are represented as mean ± SE. *P < 0.05 (n = 4 in each group); open bar, untreated hepatocytes; closed bar, IL-6–treated hepatocytes.
FIG. 3.
FIG. 3.
ER stress impairs activity of hepatic STAT3 in db/db mice. A: Tunicamycin was intraperitoneally administered to wild-type mice, and the levels of IRE1α phosphorylation and STAT3 tyrosine phosphorylation as well as expression levels of SOCS3 induced by continuous IL-6 administration were determined by Western blotting. Arrows indicate SOCS3 protein; *nonspecific band. BE: Lean control mice (lean), db/db mice (db), and PBA-treated db/db mice were subjected to continuous IL-6 administration in the presence of somatostatin. B: Level of STAT3 tyrosine phosphorylation 3 h after continuous administration of IL-6 in the liver, skeletal muscle (Mus), and white adipose tissue (WAT; left). Quantitation of STAT3 phosphorylation levels is normalized to total STAT3 and is represented as mean ± SE (right). *P < 0.05 (n = 6 in each group); open bar, lean mice; closed bar, db/db mice; striped bar, PBA-treated db/db mice. CE: Gene expression levels of Grp78 (C), Pck1 (D), and G6pc (E) in the liver by quantitative RT-PCR. Data are represented as mean ± SE. *P < 0.05 (n = 6 in each group); open bar, saline (veh)-treated; closed bar, IL-6–treated mice.
FIG. 4.
FIG. 4.
Inhibition of protein tyrosine phosphatase improves ER stress–induced suppression of JAK2 phosphorylation. A: Lean mouse–derived hepatocytes were pretreated with tunicamycin and PTP1B inhibitor followed by stimulation with IL-6 and analyzed for the effect of ER stress on cellular PTP1B activity. PTP1B activity was expressed as a percentage of that of the controls. B: db/db mouse–derived hepatocytes were treated with sodium orthovanadate (Vana) and analyzed for the levels of IL-6–dependent JAK2 phosphorylation and STAT3 phosphorylation (left). Quantitation of phosphorylation of IRE1α and STAT3 is normalized to total IRE1α and STAT3, respectively, and is represented as mean ± SE (right). *P < 0.05; open bar, lean hepatocyte; closed bar, db/db hepatocytes. C and D: Lean mouse–derived hepatocytes were pretreated with tunicamycin and sodium orthovanadate (Vana) or a PTP1B inhibitor (PTP1Bi) followed by stimulation with IL-6 and analyzed for the levels of phosphorylation of IRE1α and tyrosine phosphorylation of JAK2 and STAT3 (left). Quantitation of IRE1α, JAK2, and STAT3 phosphorylation levels is normalized to total IRE1α, JAK2, and STAT3, respectively, and is represented as mean ± SE (right). *P < 0.05.
FIG. 5.
FIG. 5.
Acetylated mutant of STAT3 is less susceptible to ER stress–induced suppression of STAT3 activation. A: Control mice (lean), db/db mice (db), and PBA-treated db/db mice were subjected to continuous IL-6 administration in the presence of somatostatin, and the level of acetylation of hepatic STAT3 was determined by Western blotting (left). Quantitation of STAT3 acetylation levels is normalized to immunoprecipitated STAT3 and is represented as mean ± SE (right). *P < 0.05 (n = 6 in each group); open bar, lean mice; closed bar, db/db mice; striped bar, PBA-treated db/db mice. B: db/db mouse–derived isolated hepatocytes were pretreated with PBA and analyzed for the level of IL-6–stimulated acetylation of STAT3 (left). Quantitation of STAT3 acetylation levels is normalized to immunoprecipitated STAT3 and is represented as mean ± SE (right). Open bar, lean hepatocyte; closed bar, db/db hepatocytes. C: Lean mouse–derived isolated hepatocytes were forced to express wild-type STAT3 or 4R mutant via adenovirus vector, treated with tunicamycin, and analyzed for the level of IL-6–dependent acetylation and tyrosine phosphorylation of exogenously induced STAT3. Cell extracts were immunoprecipitated with anti-FLAG antibody and analyzed by anti–acetyl-lysine (AcK), acetyl-STAT3, phospho-STAT3, and total STAT3 antibody. D: Lean mouse–derived hepatocytes were forced to express wild-type STAT3 or K685Q mutant via infection with an adenovirus vector, treated with tunicamycin and orthovanadate (Vana) for 6 h, and analyzed for the level of IL-6–dependent tyrosine phosphorylation of exogenously induced STAT3. The top row shows the levels of STAT3 tyrosine phosphorylation from an immunoprecipitate with anti-FLAG antibody. The bottom row shows the levels of JAK2 phosphorylation from whole cell lysate. E and F: Lean mouse–derived hepatocytes or db/db mouse–derived isolated hepatocytes were forced to express wild-type STAT3 or K685Q mutant via infection with an adenovirus vector at multiplicity of infection values 3 and 10 and analyzed for their suppressive effect on expressions of Pck1 (E) and G6pc (F) by quantitative RT-PCR. Data are represented as mean ± SE. *P < 0.05 (n = 4 in each group); open bar, β-galactosidase overexpression (control); closed bar, wild-type STAT3; striped bar, K685Q-infected mutant.
FIG. 6.
FIG. 6.
Acetylated mutant of STAT3 suppresses glucose intolerance in db/db mice. db/db mice (db) or control mice (lean) were manipulated to express wild-type STAT3 or K685Q mutant in their livers via infection with adenovirus vector and then examined for hepatic phosphorylation of STAT3 induced by glucose administration (A), blood glucose levels in a randomly fed state (B and C), and a GTT (DG). A: Tyrosine phosphorylation of hepatic STAT3 in the fasting state and after glucose administration (left). Quantitation of STAT3 phosphorylation levels is normalized to β-actin and is represented as mean ± SE (right). *P < 0.05 (n = 4 in each group); open bar, fasting mice; closed bar, glucose-administered mice. B and C: Blood glucose levels in mice in a randomly fed state are represented as mean ± SE (n = 6 in each group) in lean mice (B) and db/db mice (C). Blood glucose level (D and E) and plasma insulin levels (F and G) during the GTT in lean mice (D and F) or in db/db mice (E and G) are represented as mean ± SE (n = 6 in each group). *P < 0.05 vs. β-galactosidase overexpression; †P < 0.05 vs. wild-type STAT3 overexpression; ○, β-galactosidase overexpression; □, wild-type STAT3 overexpression; ■, K685Q mutant overexpression.
FIG. 7.
FIG. 7.
Acetylated mutant of STAT3 suppresses EGP in db/db mice to a greater degree than wild-type STAT3. db/db mice (db) or control mice (lean) were manipulated to express wild-type STAT3 or K685Q mutant in their livers via infection with adenovirus vector and examined for expression of hepatic gluconeogenic enzymes and hepatic glycogen content. A and B: Expression levels of Pck1 (A) and G6pc (B) were measured by quantitative RT-PCR (left) and Western blotting (right). Data are represented as mean ± SE (n = 6 in each group). C: Hepatic glycogen content. Data are represented as mean ± SE (n = 4 in each group). D and E: Insulin sensitivity was assayed using an euglycemic-hyperinsulinemic clamp in lean control mice (lean; D) and db/db mice (db; E). Left: glucose infusion ratio; middle: EGP before and after insulin-clamp; right: glucose disposal rate. Data are represented as mean ± SE (n = 4 in each group). *P < 0.05 vs. β-galactosidase overexpression.
FIG. 8.
FIG. 8.
HDAC inhibitor restores ER stress–induced decrease in STAT3 acetylation. AD: Tunicamycin-treated hepatocytes (A and C) or db/db mouse–derived hepatocytes (B and D) were treated with TSA (A and B) or Ex527 (C and D) and analyzed for levels of IL-6–dependent acetylation and phosphorylation of STAT3 (left). Quantitation of STAT3 acetylation level is normalized to immunoprecipitated STAT3 (top right), and quantitation of STAT3 phosphorylation levels is normalized to total STAT3; both are represented as mean ± SE (bottom right). *P < 0.05. Open bar, lean hepatocyte; closed bar, db/db hepatocytes. E: db/db mice (db) or control mice (lean) overexpressed wild-type STAT3 or K685Q mutant in their livers was examined for effects of HDAC inhibitors on hepatic STAT3 phosphorylation after glucose administration determined by Western blotting (left). Quantitation of STAT3 phosphorylation level is normalized to β-actin and is represented as mean ± SE (right). *P < 0.05 (n = 5 in each group); open bar, DMSO (veh)-treated mice; closed bar, TSA-treated mice; striped bar, Ex527-treated mice.

Similar articles

Cited by

References

    1. Magnusson I, Rothman DL, Katz LD, Shulman RG, Shulman GI. Increased rate of gluconeogenesis in type II diabetes mellitus. A 13C nuclear magnetic resonance study. J Clin Invest 1992;90:1323–1327 - PMC - PubMed
    1. Radziuk J, Pye S. Hepatic glucose uptake, gluconeogenesis and the regulation of glycogen synthesis. Diabetes Metab Res Rev 2001;17:250–272 - PubMed
    1. Herzig S, Long F, Jhala US, et al. CREB regulates hepatic gluconeogenesis through the coactivator PGC-1. Nature 2001;413:179–183 - PubMed
    1. Matsumoto M, Pocai A, Rossetti L, Depinho RA, Accili D. Impaired regulation of hepatic glucose production in mice lacking the forkhead transcription factor Foxo1 in liver. Cell Metab 2007;6:208–216 - PubMed
    1. Dentin R, Liu Y, Koo SH, et al. Insulin modulates gluconeogenesis by inhibition of the coactivator TORC2. Nature 2007;449:366–369 - PubMed

Publication types

MeSH terms