. 2012 Jan;61(1):187-96.
doi: 10.2337/db11-1029. Epub 2011 Nov 28.

Na(+)-D-glucose cotransporter SGLT1 is pivotal for intestinal glucose absorption and glucose-dependent incretin secretion

Affiliations

Na(+)-D-glucose cotransporter SGLT1 is pivotal for intestinal glucose absorption and glucose-dependent incretin secretion

Valentin Gorboulev et al. Diabetes. 2012 Jan.

Abstract

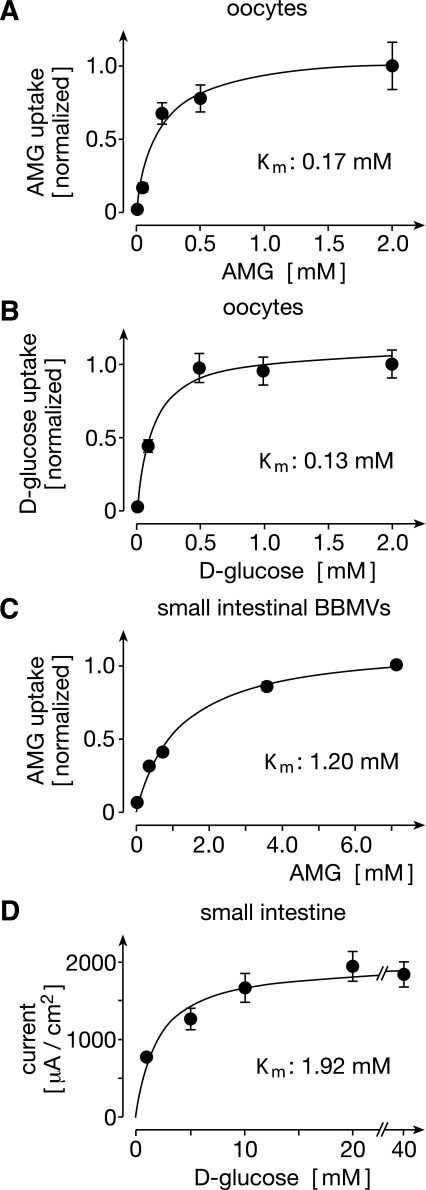
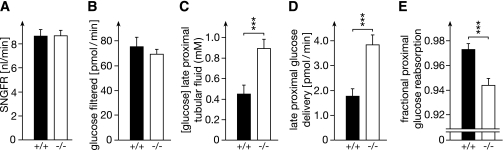
To clarify the physiological role of Na(+)-D-glucose cotransporter SGLT1 in small intestine and kidney, Sglt1(-/-) mice were generated and characterized phenotypically. After gavage of d-glucose, small intestinal glucose absorption across the brush-border membrane (BBM) via SGLT1 and GLUT2 were analyzed. Glucose-induced secretion of insulinotropic hormone (GIP) and glucagon-like peptide 1 (GLP-1) in wild-type and Sglt1(-/-) mice were compared. The impact of SGLT1 on renal glucose handling was investigated by micropuncture studies. It was observed that Sglt1(-/-) mice developed a glucose-galactose malabsorption syndrome but thrive normally when fed a glucose-galactose-free diet. In wild-type mice, passage of D-glucose across the intestinal BBM was predominantly mediated by SGLT1, independent the glucose load. High glucose concentrations increased the amounts of SGLT1 and GLUT2 in the BBM, and SGLT1 was required for upregulation of GLUT2. SGLT1 was located in luminal membranes of cells immunopositive for GIP and GLP-1, and Sglt1(-/-) mice exhibited reduced glucose-triggered GIP and GLP-1 levels. In the kidney, SGLT1 reabsorbed ∼3% of the filtered glucose under normoglycemic conditions. The data indicate that SGLT1 is 1) pivotal for intestinal mass absorption of d-glucose, 2) triggers the glucose-induced secretion of GIP and GLP-1, and 3) triggers the upregulation of GLUT2.


Figures

FIG. 1.
FIG. 1.
Deletion of Sglt1 in small intestine leads to GGM syndrome that can be prevented by a glucose-galactose–reduced diet. A: Body weight development after weaning. Sglt1+/− mice receiving standard diet (s.d.) were bred. Newborn mice were genotyped 3 weeks after birth. After weaning, Sglt1+/+ and Sglt1−/− mice were kept on standard diet or glucose/galactose-reduced diet (r.d.). Mean values ± SE of 8 animals are shown. B: Body weight development of 2-month-old mice that have been kept on glucose-galactose–reduced diet and were then switched to standard diet. Mean values ± SE are shown; n = 5 wild-type and 5 Sglt1−/− mice (initial number of mice). †Death of one Sglt1−/− mouse; ††Death of two SGLT1−/− mice. C: Appearance of abdominal contents of 2-month-old mice kept on glucose-galactose–reduced diet after weaning that were fed 2 days with standard diet. D: Northern blots with mRNAs isolated from small intestines of 2-month-old mice hybridized with cDNA fragments of Sglt1 or glyceraldehyde-3-phosphate dehydrogenase (GAPDH). A 176 bp Sglt1 fragment comprising nucleotides 1727–1902 (accession number AF163846) and a 1.1 kb fragment of human GAPDH (Clontech, Heidelberg, Germany) was used. E: Western blots of small intestinal BBMs of 2-month-old mice, which were performed as described (28), were stained with antibody against SGLT1 (SGLT1-Ab, diluted 1:2,000). F: Immunohistochemistry of small intestine with SGLT1-Ab (dilution of SGLT1-Ab, 1:1,000; scale bar, 20 µm). G: Phlorizin-inhibitable uptake of 7 μmol/L AMG into enterocytes of everted rings of small intestine. Because phlorizin-inhibitable AMG uptake in duodenum and jejunum was not significantly different the measurements from both regions were combined. Mean values of phlorizin-inhibitable AMG uptake ± SE from four independent experiments are shown. H: d-glucose induced transepithelial short-circuit currents (Isc). Small intestinal mucosa mounted into Ussing chambers was superfused at 37°C in the presence of 20 mmol/L mannitol or 20 mmol/L d-glucose, and electrogenic glucose uptake was measured as described (29). Mean values ± SE of five experiments. *P < 0.05, **P < 0.01, ***P < 0.001 determined by Student t tests. (A high-quality digital representation of this figure is available in the online issue.)
FIG. 2.
FIG. 2.
Upregulation of small intestinal d-glucose absorption after application of a d-glucose bolus to the stomach. A: d-glucose concentrations in the plasma after gavage with d-glucose (2 mg/g body wt; Sglt1+/+, ●, Sglt1−/−, ○) or buffer (Sglt1+/+, ■; Sglt1−/−, □). ***P < 0.001, Sglt1+/+ mice after glucose gavage vs. Sglt1−/− mice after glucose gavage; •••P < 0.001 differences to the d-glucose concentration in Sglt1−/− mice before glucose gavage. B-F: Properties of small intestine BBMVs of control Sglt1+/+ and Sglt1−/− mice (bolus) and of Sglt1+/+ and Sglt1−/− mice that had received a d-glucose bolus (6 mg/g body wt) 30 min earlier (+bolus). B: Km values for AMG of Na+-dependent uptake of [14C]AMG into BBMVs. Uptake rates were measured after incubation for 5 s in the presence of an inwardly directed gradient of 100 mmol/L NaSCN or 100 mmol/L KSCN, and the differences were calculated. C: Phlorizin-inhibitable uptake of AMG into BBMVs. Uptake of 0.1 mmol/L [14C]AMG was measured after incubation for 2 s in the absence and presence of 200 μmol/L phlorizin, and the differences were calculated. Vmax values were calculated according to the Michaelis Menten equation using the Km values determined in B. D: SGLT1 protein expressed in BBMVs. Western blots of BBMVs (26) were stained with SGLT1-Ab (diluted 1:2,000), and the staining was quantified by densitometry. E: Glucosamine-inhibitable uptake of d-glucose into BBMVs. Uptake rates of 100 mmol/L [3H]d-glucose were measured in the absence and presence of 100 mmol/L d-glucosamine, and the differences were calculated. Because the Michaelis Menten constant (Km) value of mouse GLUT2 for d-glucose is ∼17 mmol/L (4), the uptake rates of 100 mmol/L d-glucose represent Vmax values. E: GLUT2 protein expression in BBMVs. Western blots of BBMVs (27) were stained with antibody against human GLUT2 (diluted 1:500) cross-reacting with mouse GLUT2. Staining was quantified by densitometry. Means ± SE are presented. The number of independent experiments is indicated in parentheses. Significances of differences are calculated by ANOVA with post hoc Tukey comparison. *P < 0.05; **P < 0.01; ***P < 0.001; rel., relative.
FIG. 3.
FIG. 3.
The substrate dependence of SGLT1-mediated glucose uptake expressed in oocytes is different from the substrate dependence of SGLT1-mediated glucose uptake across small intestinal BBM. A and B: Transport measurements in oocytes. Oocytes were injected with 5 ng of mouse Sglt1 cRNA and incubated 2 days for expression. Uptake of different concentrations of [14C]AMG (A) or [3H]d-glucose (B) was measured in the absence and presence of 100 μmol/L phlorizin. Phlorizin-inhibitable uptake rates of individual experiments were normalized to the uptake rates measured at 2 mmol/L AMG or d-glucose. Mean values + SE of 25–30 oocytes from 3 independent experiments are shown. Similar apparent Km values of 0.17 ± 0.05 mmol/L and 0.13 ± 0.01 mmol/L were obtained for AMG and d-glucose, respectively. The Vmax values of SGLT1-mediated uptake of AMG and d-glucose were similar. In oocytes of the same batch, which were injected with 5 ng of Sglt1 cRNA per oocyte and incubated for 2 days, Vmax values (measured at monosaccharide concentrations of 2 mmol/L without and with 100 μmol/L phlorizin) of 5.0 ± 0.6 (AMG) and 4.8 ± 0.6 (d-glucose) pmol × oocyte1 × min1 were obtained (n = 25 each, not significant). C: Transport measurements in BBMVs. Wild-type mice fed with standard diet were starved for 18 h and killed at 3–4 p.m. BBMVs were prepared. BBMVs were incubated for 2 s at 37°C with different concentrations of [14C]AMG in the presence of an inwardly directed gradient of 100 mmol/L NaSCN or 100 mmol/L KSCN. The sodium-dependent uptake rates of individual experiments were normalized to the values obtained at 10 mmol/L AMG. Mean values ± SE of 12 measurements from three independent experiments are shown. A Km value of 1.20 ± 0.04 mmol/L (n = 5) was determined. D: Glucose-induced short circuit currents across small intestinal mucosa. Wild-type mice fed with standard diet were starved for 18 h and killed at 4 p.m. The jejunal small intestinal wall was then mounted to an Ussing chamber. The mucosal side was superfused with different concentrations of d-glucose, and d-glucose–induced short circuit currents (Isc) mediated by Na+ -d-glucose cotransport was measured. Mean values ± SE of 7 experiments are shown. The Michaelis Menten equation was fitted to the data. A Km value of 1.9 ± 0.6 mmol/L was determined.
FIG. 4.
FIG. 4.
Expression of SGLT1 in enteroendocrine cells. Sections from jejunum of mice were first incubated with antibodies against GIP or GLP-1 raised in goat and then with SGLT1-Ab raised in rabbit (GIP-Ab and GLP-1 were diluted 1:100, and SGLT1-Ab diluted 1:1,000). Staining was performed with fluorescent-labeled secondary antibodies (diluted 1:800) against goat IgG (GIP or GLP-1, green) and rabbit IgG (SGLT1, red). A and B: K-cell in crypts. C: L-cell in a crypt. Scale bar, 5 µm. (A high-quality digital representation of this figure is available in the online issue.)
FIG. 5.
FIG. 5.
Secretion of insulin, GIP, and GLP-1 after gavage with d-glucose in Sglt1−/− mice versus Sglt+/+ mice. A: Effect of d-glucose gavage (2 mg/g body wt) on systemic plasma insulin concentrations. B: Concentrations of GIP in systemic blood plasma before and 13 min after gavage with d-glucose (G bolus; 2 mg/g body wt) or 13 min after gavage with oil (10 µL/g body wt). C: Concentrations of active GLP-1 in systemic blood plasma before and 13 min after gavage with d-glucose (2 mg/g body wt) or oil. D: Concentration of total GLP-1 in systemic blood plasma 5 min after gavage with PBS (B bolus) or d-glucose (G bolus; 6 mg/g body wt). *P < 0.05, **P < 0.01, ***P < 0.001, Student t tests.
FIG. 6.
FIG. 6.
Effects of SGLT1 removal on renal glucose excretion. A: d-glucose concentrations measured in spontaneous urine collections and subsequently obtained blood collections from tail vein of awake male mice (for experimental details [29]). B: Absolute renal excretion and fractional reabsorption of glucose in male Sglt1−/− versus Sglt1+/+ mice as function of the amount of filtered glucose. GFR was measured in awake mice using the plasma kinetics of FITC-inulin after a single dose intravenous injection (26). Mean values ± SE are shown. bw, Body weight.
FIG. 7.
FIG. 7.
Micropuncture studies in male wild-type and Sglt1−/− mice. Mice were anesthetized with thiobutabarbital (100 mg/kg i.p.) plus ketamine (100 mg/kg i.m.) and prepared for renal micropuncture as described (20,27). A catheter was placed in the femoral artery for continuous blood pressure recording, and a bladder catheter was applied for urine collections. For assessment of GFR, [3H]inulin was added to the infusion to deliver 20 µCi/h and urine was quantitatively collected. To determine proximal glucose reabsorption, quantitative free-flow fluid collections were made from the last surface loop of proximal convoluted tubules and tubular fluid volume was determined from transfer to a constant bore capillary. Concentrations of glucose in plasma, urine, and tubular fluid were determined as described (27). A: GFRs of single nephrons (SNGFR). B: Filtration of d-glucose by single nephrons. C: d-glucose concentrations in the last surface loops of proximal tubules. D: Amount of d-glucose delivered to the last surface loops of proximal tubules. E: Fractional reabsorption of d-glucose up to the last proximal tubular surface loops. Nephrons (2–25) in five to six mice/genotype were investigated. Mean values ± SE are shown. ***P < 0.001, Student t tests.

Comment in

Similar articles

Cited by

References

    1. Marsenic O. Glucose control by the kidney: an emerging target in diabetes. Am J Kidney Dis 2009;53:875–883 - PubMed
    1. Brubaker PL. Incretin-based therapies: mimetics versus protease inhibitors. Trends Endocrinol Metab 2007;18:240–245 - PubMed
    1. Wright EM, Loo DDF, Hirayama BA. Biology of human sodium glucose transporters. Physiol Rev 2011;91:733–794 - PubMed
    1. Uldry M, Thorens B. The SLC2 family of facilitated hexose and polyol transporters. Pflugers Arch 2004;447:480–489 - PubMed
    1. Kellett GL. The facilitated component of intestinal glucose absorption. J Physiol 2001;531:585–595 - PMC - PubMed

Publication types

MeSH terms