Review
. 2011 Nov 29;13(1):36-46.
doi: 10.1038/nrg3117.

Repetitive DNA and next-generation sequencing: computational challenges and solutions

Affiliations
Review

Repetitive DNA and next-generation sequencing: computational challenges and solutions

Todd J Treangen et al. Nat Rev Genet. .

Erratum in

  • Nat Rev Genet. 2012 Feb;13(2):146

Abstract

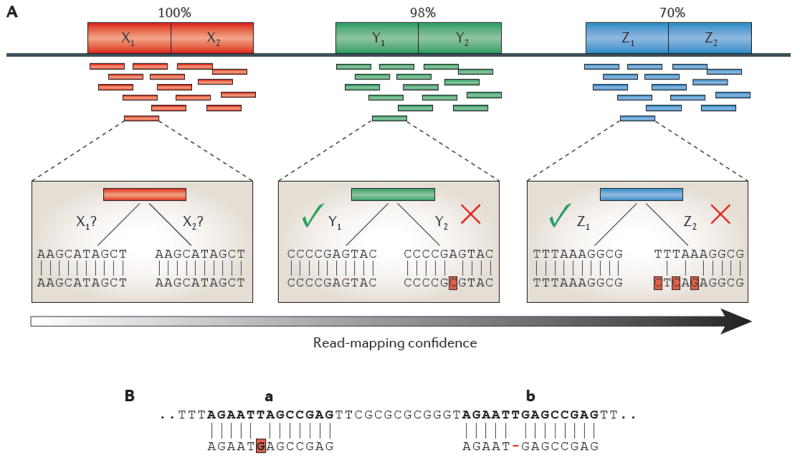
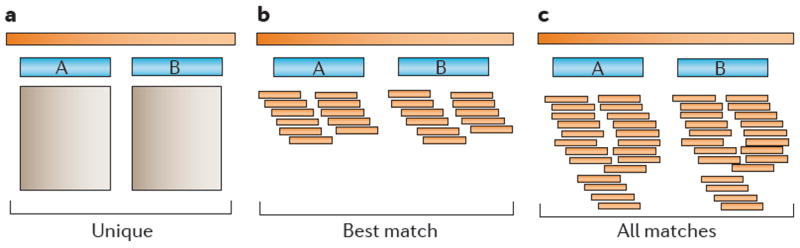
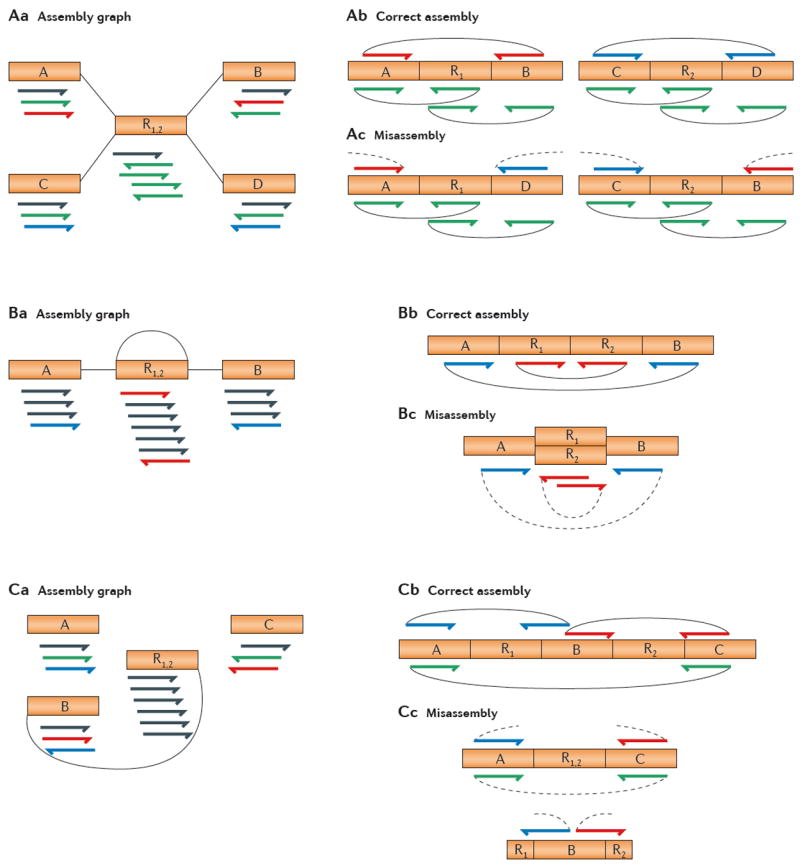
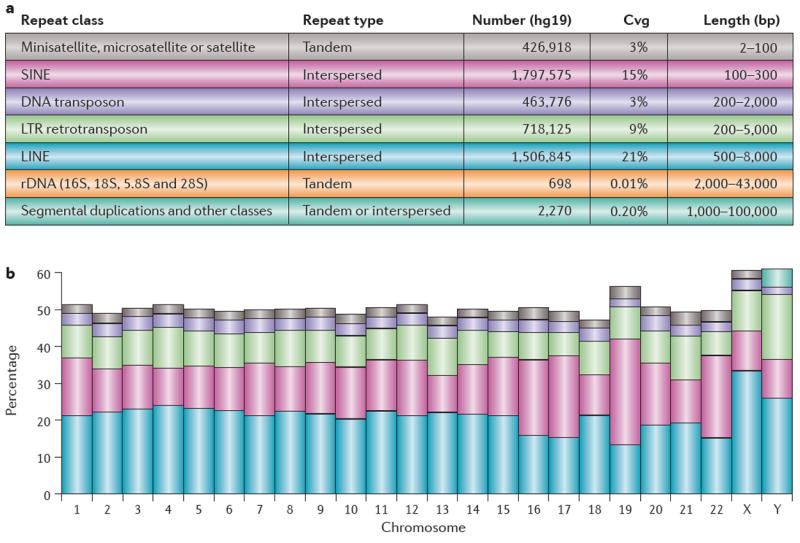
Repetitive DNA sequences are abundant in a broad range of species, from bacteria to mammals, and they cover nearly half of the human genome. Repeats have always presented technical challenges for sequence alignment and assembly programs. Next-generation sequencing projects, with their short read lengths and high data volumes, have made these challenges more difficult. From a computational perspective, repeats create ambiguities in alignment and assembly, which, in turn, can produce biases and errors when interpreting results. Simply ignoring repeats is not an option, as this creates problems of its own and may mean that important biological phenomena are missed. We discuss the computational problems surrounding repeats and describe strategies used by current bioinformatics systems to solve them.


Conflict of interest statement

Competing interests statement

The authors declare no competing financial interests.

Figures

Figure 1
Figure 1. Ambiguities in read mapping
A Read-mapping confidence versus repeat-copy similarity. As the similarity between two copies of a repeat increases, the confidence in any read placement within the repeat decreases. At the top of the figure, we show three different tandem repeats with two copies each. Directly beneath these tandem repeats are reads that are sequenced from these regions. For each tandem repeat, we have highlighted and zoomed in on a single read. Starting with the leftmost read (red) from tandem repeat X, we have low confidence when mapping this read within the tandem repeat, because it aligns equally well to both X1 and X2. In the middle example (tandem repeat Y, green), we have a higher confidence in the mapping owing to a single nucleotide difference, making the alignment to Y1 slightly better than Y2. In the rightmost example, the blue read that is sequenced from tandem repeat Z aligns perfectly to Z1, whereas its alignment to Z2 contains three mismatches, giving us a high confidence when mapping the read to Z1. B | Ambiguity in read mapping. The 13 bp read shown along the bottom maps to two locations, a and b, where there is a mismatch at location a and a deletion at b. If mismatches are considered to be less costly, then the alignment program will put the read in location a. However, the source DNA might have a true deletion in location b, meaning that the true position of the read is b.
Figure 2
Figure 2. Three strategies for mapping multi-reads
The shaded rectangles at the top represent intervals along a chromosome. The two blue rectangles below each region represent an identical two-copy repeat containing the paralogous genes A and B. The small orange bars represent reads aligned to specific positions. a | The ‘unique’ strategy reports only those reads that are uniquely mappable. Because A and B are identical, no alignments are reported. b | The ‘best match’ alignment strategy reports the best possible alignment for each read, which is determined by the scoring function of the alignment algorithm. In the case of ties, this strategy randomly distributes reads across equally good loci, as shown here. c | The ‘all matches’ strategy simply reports all alignments for each multi-read, including lower-scoring alignments.
Figure 3
Figure 3. Assembly errors caused by repeats
A | Rearrangement assembly error caused by repeats. Aa | An example assembly graph involving six contigs, two of which are identical (R1 and R2). The arrows shown below each contig represent the reads that are aligned to it. Ab | The true assembly of two contigs, showing mate-pair constraints for the red, blue and green paired reads. Ac | Two incorrectly assembled chimeric contigs caused by the repetitive regions R1 and R2. Note that all reads align perfectly to the misassembled contigs, but the mate-pair constraints are violated. B | A collapsed tandem repeat. Ba | The assembly graph contains four contigs, where R1 and R2 are identical repeats. Bb | The true assembly, showing mate-pair constraints for the red and blue paired reads, which are oriented correctly and spaced the correct distance apart. Bc | A misassembly that is caused by collapsing repeats R1 and R2 on top of each other. Read alignments remain consistent, but mate-pair distances are compressed. A different misassembly of this region might reverse the order of R1 and R2. C | A collapsed interspersed repeat. Ca | The assembly graph contains five contigs, where R1 and R2 are identical repeats. Cb | In the correct assembly, R1 and R2 are separated by a unique sequence. Cc | The two copies of the repeat are collapsed onto one another. The unique sequence is then left out of the assembly and appears as an isolated contig with partial repeats on its flank.
Figure 4
Figure 4. Longer paired-end libraries improved assembly contiguity in the repetitive potato genome
Each point represents the scaffold N50 size of an assembly of the potato genome that was built using paired-end reads from inserts of a specific size and smaller. Successive points moving from left to right used all previous data plus one additional, longer paired-end library size, which is plotted on the y axis. With the addition of the final, 20 kb library, the scaffold N50 size reached 1.3 Mb. The data in this figure are taken from REF. .
Figure 5
Figure 5

Similar articles

Cited by

References

    1. Weigel D, Mott R. The 1001 genomes project for Arabidopsis thaliana. Genome Biol. 2009;10:107. - PMC - PubMed
    1. The 1000 Genomes Project Consurtium. A map of human genome variation from population-scale sequencing. Nature. 2010;467:1061–1073. - PMC - PubMed
    1. Genome 10K Community of Scientists. Genome 10K: a proposal to obtain whole-genome sequence for 10,000 vertebrate species. J Hered. 2009;100:659–674. - PMC - PubMed
    1. Nagalakshmi U, et al. The transcriptional landscape of the yeast genome defined by RNA sequencing. Science. 2008;320:1344–1349. - PMC - PubMed
    1. Mortazavi A, Williams BA, McCue K, Schaeffer L, Wold B. Mapping and quantifying mammalian transcriptomes by RNA-seq. Nature Methods. 2008;5:621–628. - PubMed