

In vivo estimation of bone stiffness at the distal femur and proximal tibia using ultra-high-field 7-Tesla magnetic resonance imaging and micro-finite element analysis
- PMID: 22124539
- PMCID: PMC3723134
- DOI: 10.1007/s00774-011-0333-1
In vivo estimation of bone stiffness at the distal femur and proximal tibia using ultra-high-field 7-Tesla magnetic resonance imaging and micro-finite element analysis
Abstract
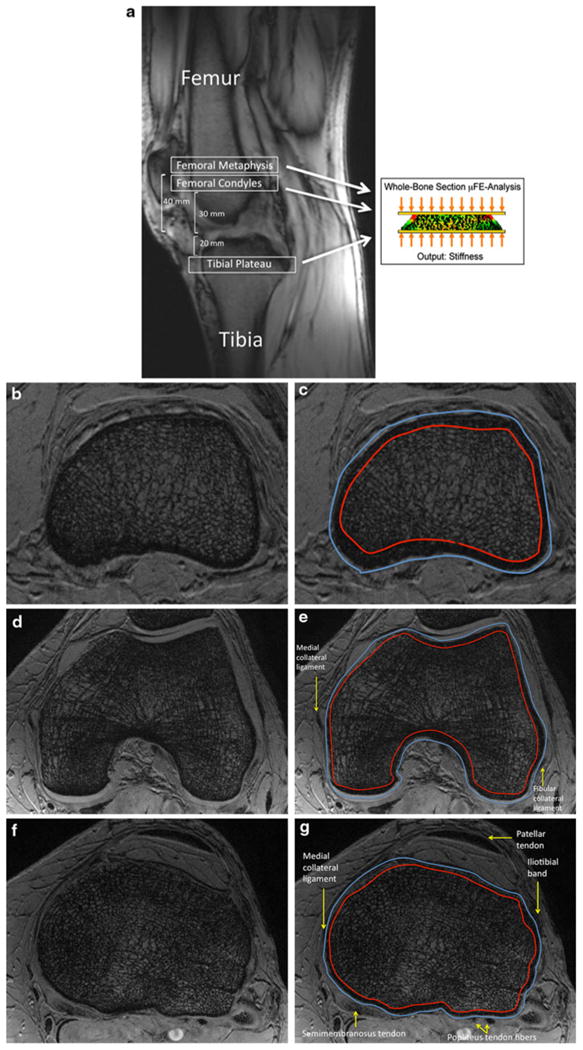
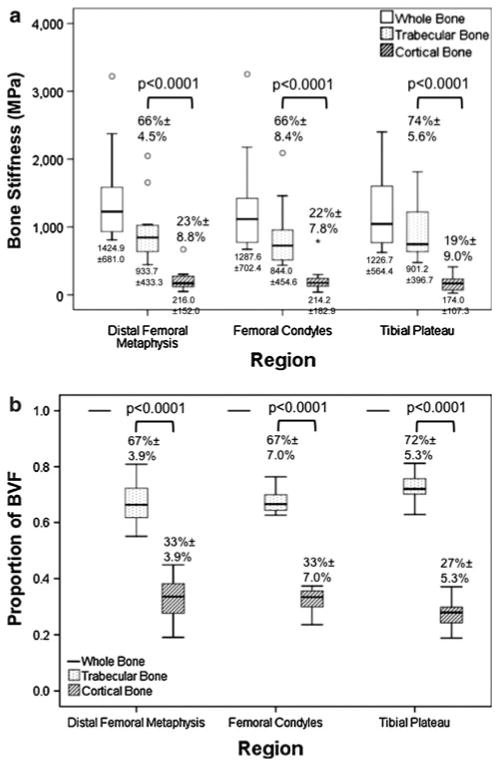
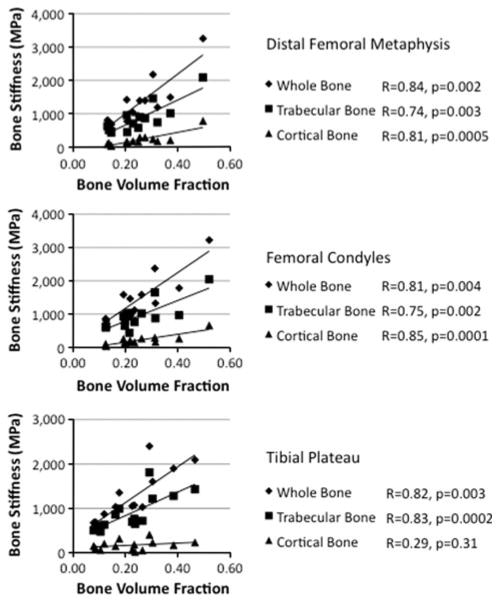
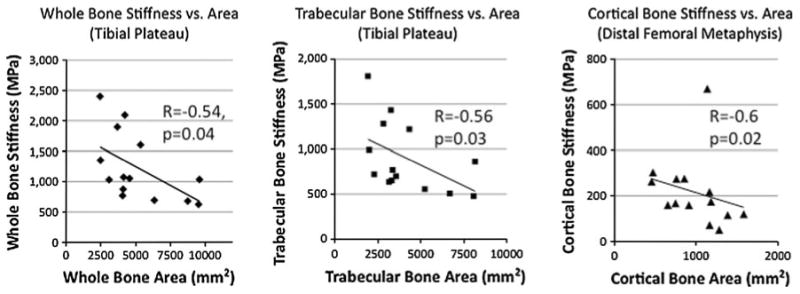
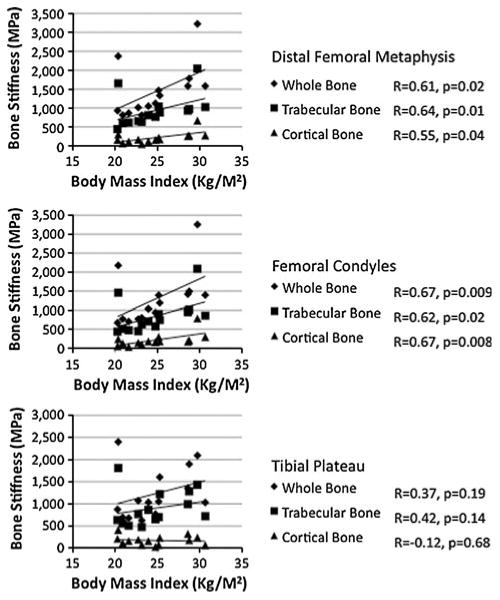
The goal of this study was to demonstrate the feasibility of using 7-Tesla (7T) magnetic resonance imaging (MRI) and micro-finite element analysis (µFEA) to evaluate mechanical and structural properties of whole, cortical, and trabecular bone at the distal femur and proximal tibia in vivo. 14 healthy subjects were recruited (age 40.7 ± 15.7 years). The right knee was scanned on a 7T MRI scanner using a 28 channel-receive knee coil and a three-dimensional fast low-angle shot sequence (TR/TE 20 ms/5.02 ms, 0.234 mm × 0.234 mm × 1 mm, 80 axial images, 7 min 9 s). Bone was analyzed at the distal femoral metaphysis, femoral condyles, and tibial plateau. Whole, cortical, and trabecular bone stiffness was computed using µFEA. Bone volume fraction (BVF), bone areas, and cortical thickness were measured. Trabecular bone stiffness (933.7 ± 433.3 MPa) was greater than cortical bone stiffness (216 ± 152 MPa) at all three locations (P < 0.05). Across locations, there were no differences in bone stiffness (whole, cortical, or trabecular). Whole, cortical, and trabecular bone stiffness correlated with BVF (R ≥ 0.69, P < 0.05) and inversely correlated with corresponding whole, cortical, and trabecular areas (R ≤ -0.54, P < 0.05), but not with cortical thickness (R < -0.11, P > 0.05). Whole, cortical, and trabecular stiffness correlated with body mass index (R ≥ 0.62, P < 0.05). In conclusion, at the distal femur and proximal tibia, trabecular bone contributes 66-74% of whole bone stiffness. 7T MRI and µFEA may be used as a method to provide insight into how structural properties of cortical or trabecular bone affect bone mechanical competence in vivo.
Conflict of interest statement
Figures
References
-
- Griffith JF, Engelke K, Genant HK. Looking beyond bone mineral density: imaging assessment of bone quality. Ann N Y Acad Sci. 2010;1192:45–56. - PubMed
-
- Ito M. Recent progress in bone imaging for osteoporosis research. J Bone Miner Metab. 2011;29:131–140. - PubMed
-
- Wehrli FW, Saha PK, Gomberg BR, et al. Role of magnetic resonance for assessing structure and function of trabecular bone. Top Magn Reson Imaging. 2002;13:335–355. - PubMed
-
- Watts NB. Fundamentals and pitfalls of bone densitometry using dual-energy X-ray absorptiometry (DXA) Osteoporos Int. 2004;15:847–854. - PubMed
-
- Bolotin HH. DXA in vivo BMD methodology: an erroneous and misleading research and clinical gauge of bone mineral status, bone fragility, and bone remodelling. Bone. 2007;41:138–154. - PubMed
Publication types
MeSH terms
Grants and funding
LinkOut - more resources
Full Text Sources
Medical
