

Cryo-image analysis of tumor cell migration, invasion, and dispersal in a mouse xenograft model of human glioblastoma multiforme
- PMID: 22125093
- PMCID: PMC3444683
- DOI: 10.1007/s11307-011-0525-z
Cryo-image analysis of tumor cell migration, invasion, and dispersal in a mouse xenograft model of human glioblastoma multiforme
Abstract
Purpose: The goals of this study were to create cryo-imaging methods to quantify characteristics (size, dispersal, and blood vessel density) of mouse orthotopic models of glioblastoma multiforme (GBM) and to enable studies of tumor biology, targeted imaging agents, and theranostic nanoparticles.
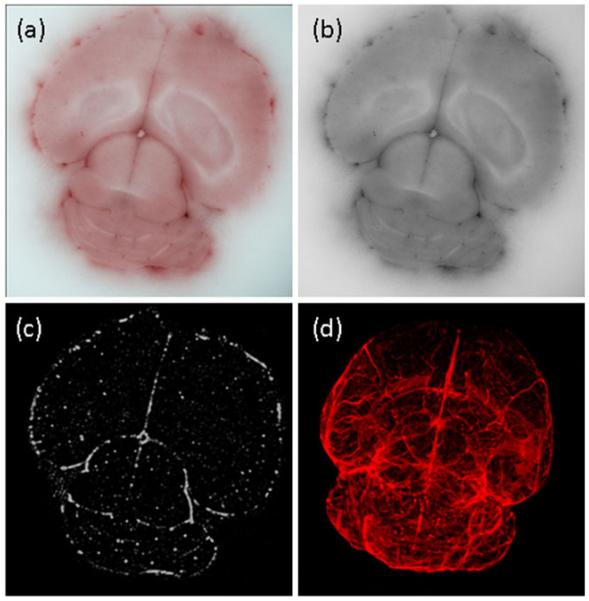
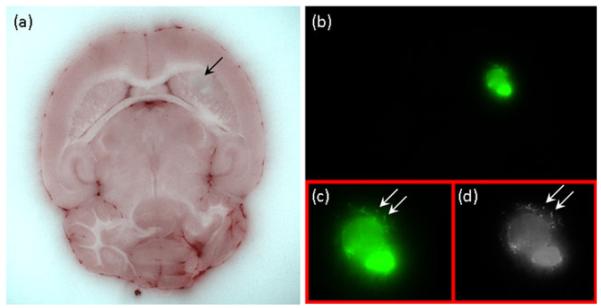
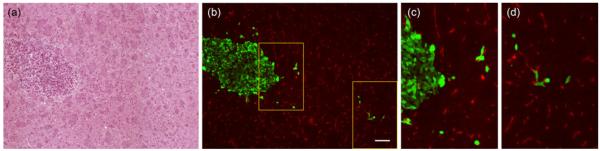
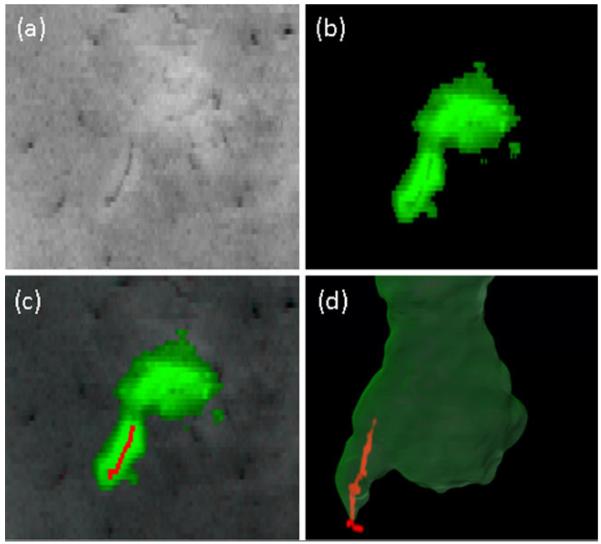
Procedures: Green fluorescent protein-labeled, human glioma LN-229 cells were implanted into mouse brain. At 20-38 days, cryo-imaging gave whole brain, 4-GB, 3D microscopic images of bright field anatomy, including vasculature, and fluorescent tumor. Image analysis/visualization methods were developed.
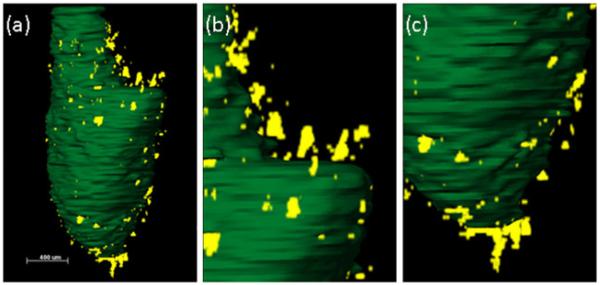
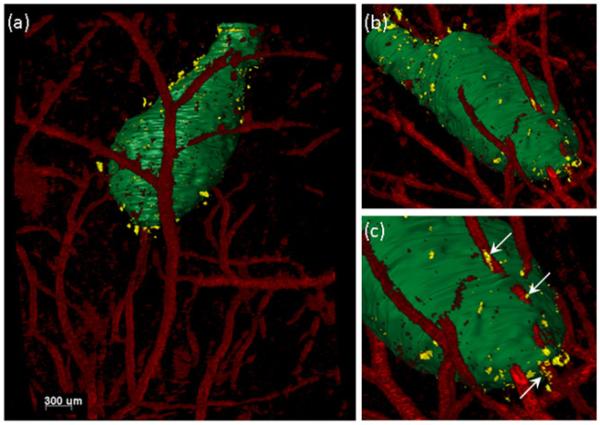
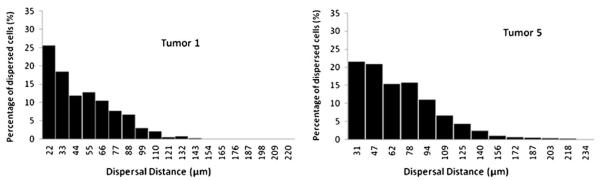
Results: Vessel visualization and segmentation methods successfully enabled analyses. The main tumor mass volume, the number of dispersed clusters, the number of cells/cluster, and the percent dispersed volume all increase with age of the tumor. Histograms of dispersal distance give a mean and median of 63 and 56 μm, respectively, averaged over all brains. Dispersal distance tends to increase with age of the tumors. Dispersal tends to occur along blood vessels. Blood vessel density did not appear to increase in and around the tumor with this cell line.
Conclusion: Cryo-imaging and software allow, for the first time, 3D, whole brain, microscopic characterization of a tumor from a particular cell line. LN-229 exhibits considerable dispersal along blood vessels, a characteristic of human tumors that limits treatment success.
Figures
Similar articles
-
Novel cryo-imaging of the glioma tumor microenvironment reveals migration and dispersal pathways in vivid three-dimensional detail.Cancer Res. 2011 Sep 1;71(17):5932-40. doi: 10.1158/0008-5472.CAN-11-1553. Epub 2011 Aug 23. Cancer Res. 2011. PMID: 21862632 Free PMC article.
-
CXCR4-STAT3 Axis Plays a Role in Tumor Cell Infiltration in an Orthotopic Mouse Glioblastoma Model.Mol Cells. 2020 Jun 30;43(6):539-550. doi: 10.14348/molcells.2020.0098. Mol Cells. 2020. PMID: 32597394 Free PMC article.
-
Effect of human skin-derived stem cells on vessel architecture, tumor growth, and tumor invasion in brain tumor animal models.Cancer Res. 2007 Apr 1;67(7):3054-63. doi: 10.1158/0008-5472.CAN-06-1384. Cancer Res. 2007. PMID: 17409412
-
Vessel co-option in glioblastoma: emerging insights and opportunities.Angiogenesis. 2020 Feb;23(1):9-16. doi: 10.1007/s10456-019-09691-z. Epub 2019 Nov 2. Angiogenesis. 2020. PMID: 31679081 Free PMC article. Review.
-
Mechanisms of tumor development and anti-angiogenic therapy in glioblastoma multiforme.Neurol Med Chir (Tokyo). 2013;53(11):755-63. doi: 10.2176/nmc.ra2013-0200. Epub 2013 Oct 25. Neurol Med Chir (Tokyo). 2013. PMID: 24162241 Free PMC article. Review.
Cited by
-
Contemporary Mouse Models in Glioma Research.Cells. 2021 Mar 23;10(3):712. doi: 10.3390/cells10030712. Cells. 2021. PMID: 33806933 Free PMC article. Review.
-
Developing a novel hyperspectral imaging cryomacrotome for whole body fluorescence imaging.Proc SPIE Int Soc Opt Eng. 2020;11219:112190M. doi: 10.1117/12.2544497. Epub 2020 Feb 21. Proc SPIE Int Soc Opt Eng. 2020. PMID: 34446979 Free PMC article.
-
A hyperspectral approach for recovering agent excretion biodistributions using whole-body fluorescence cryo-imaging.Proc SPIE Int Soc Opt Eng. 2021 Mar;11625:116250P. doi: 10.1117/12.2582534. Epub 2021 Mar 5. Proc SPIE Int Soc Opt Eng. 2021. PMID: 34177040 Free PMC article.
-
Automatic Stem Cell Detection in Microscopic Whole Mouse Cryo-Imaging.IEEE Trans Med Imaging. 2016 Mar;35(3):819-29. doi: 10.1109/TMI.2015.2497285. Epub 2015 Nov 2. IEEE Trans Med Imaging. 2016. PMID: 26552080 Free PMC article.
-
Quantitative analysis of metastatic breast cancer in mice using deep learning on cryo-image data.Sci Rep. 2021 Sep 1;11(1):17527. doi: 10.1038/s41598-021-96838-y. Sci Rep. 2021. PMID: 34471169 Free PMC article.
References
-
- Furnari FB, Fenton T, Bachoo RM, Mukasa A, Stommel JM, Stegh A, Hahn WC, Ligon KL, Louis DN, Brennan C, Chin L, DePinho RA, Cavenee WK. Malignant astrocytic glioma: genetics, biology, and paths to treatment. Genes Dev. 2007;21:2683–2710. - PubMed
-
- Ichimura K, Ohgaki H, Kleihues P, Collins VP. Molecular pathogenesis of astrocytic tumours. J Neurooncol. 2004;70:137–160. - PubMed
-
- Louis DN. Molecular pathology of malignant gliomas. Annu Rev Pathol. 2006;1:97–117. - PubMed
Publication types
MeSH terms
Grants and funding
LinkOut - more resources
Full Text Sources
Other Literature Sources
Medical
