. 2011 Dec;35(8):766-80.
doi: 10.1002/gepi.20626.

Haplotype variation and genotype imputation in African populations

Affiliations

Haplotype variation and genotype imputation in African populations

Lucy Huang et al. Genet Epidemiol. 2011 Dec.

Abstract

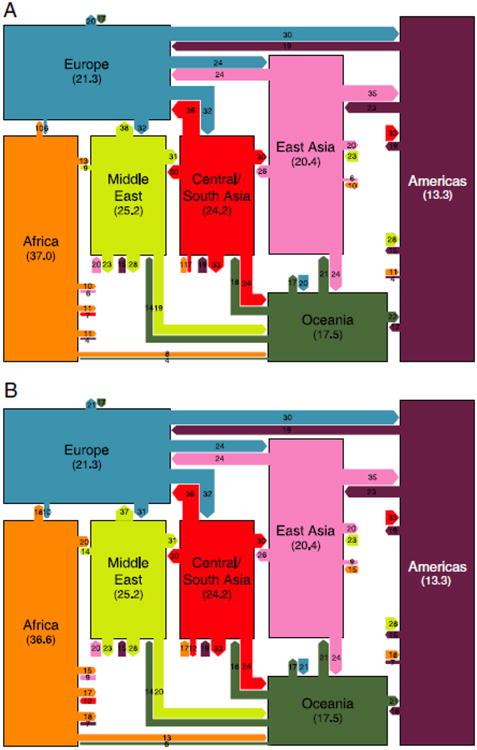
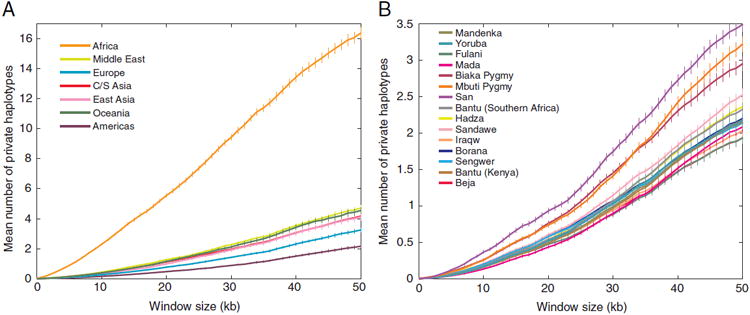
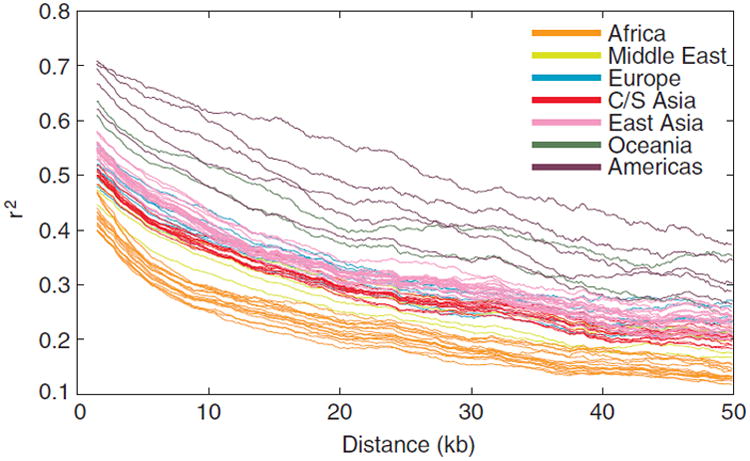
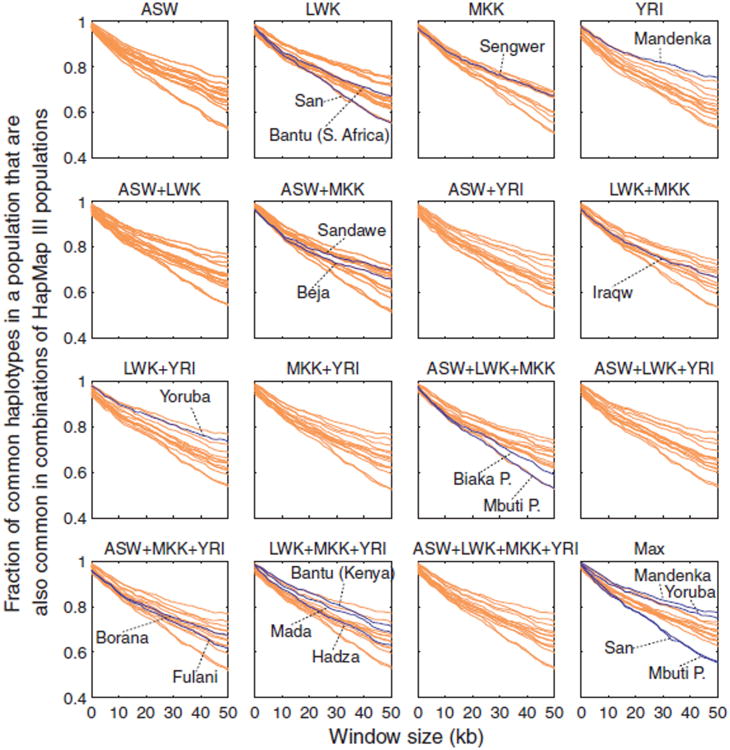
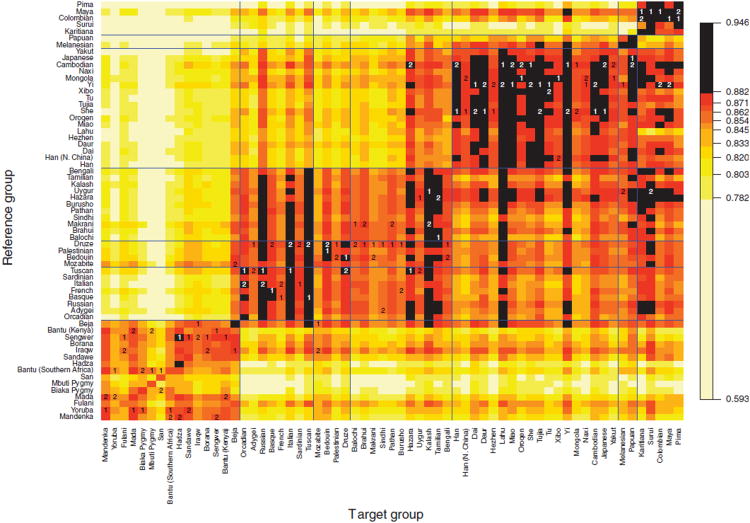
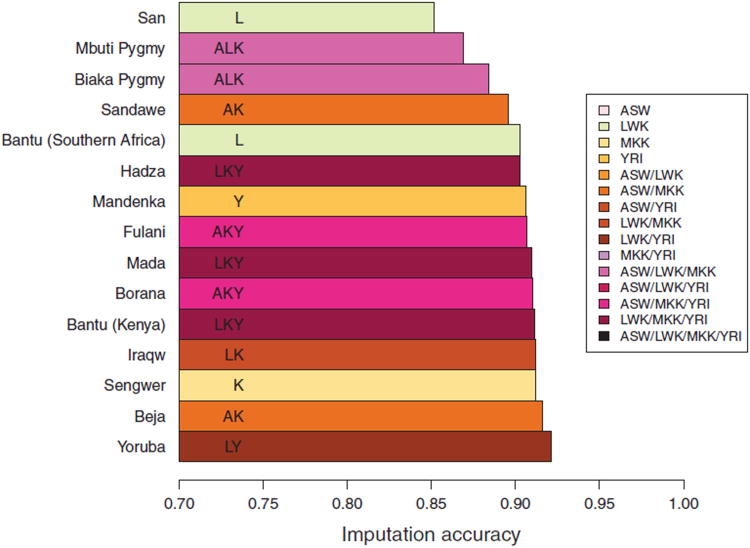
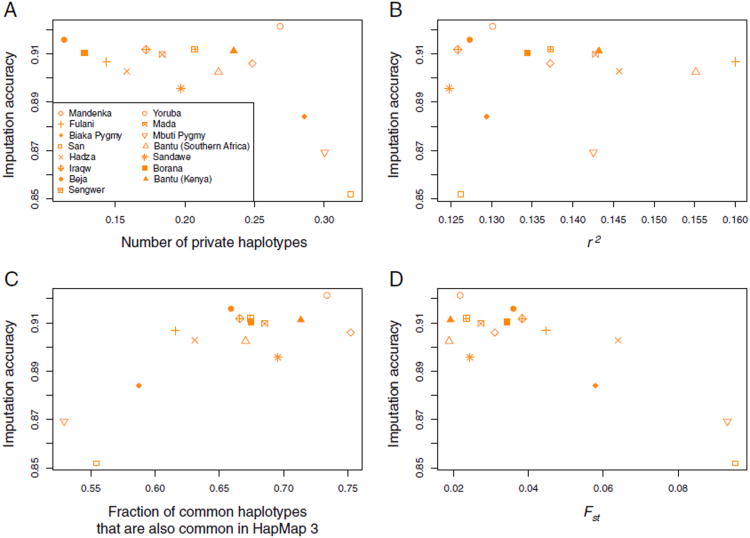
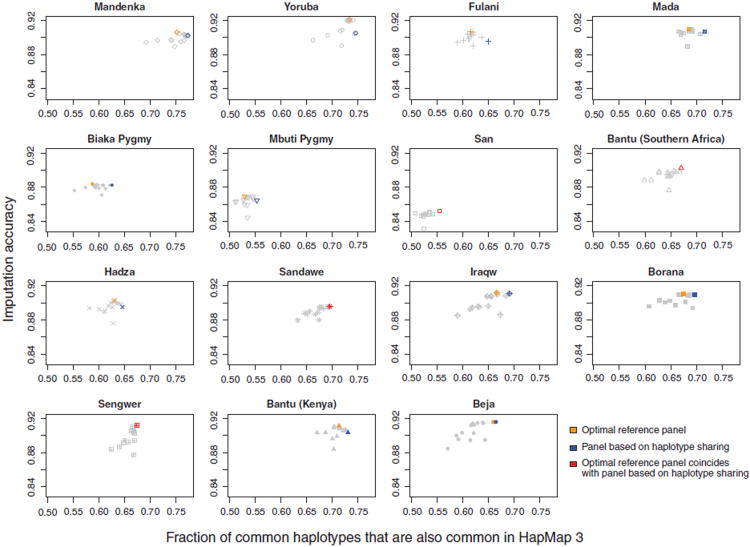
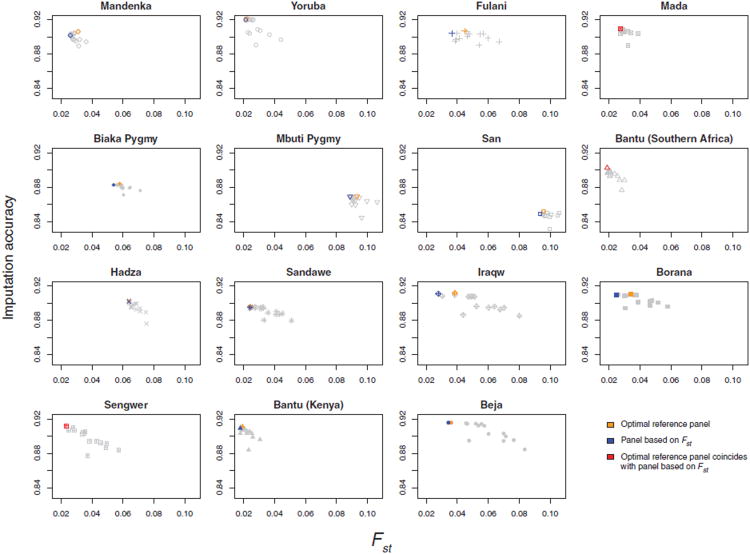
Sub-Saharan Africa has been identified as the part of the world with the greatest human genetic diversity. This high level of diversity causes difficulties for genome-wide association (GWA) studies in African populations-for example, by reducing the accuracy of genotype imputation in African populations compared to non-African populations. Here, we investigate haplotype variation and imputation in Africa, using 253 unrelated individuals from 15 Sub-Saharan African populations. We identify the populations that provide the greatest potential for serving as reference panels for imputing genotypes in the remaining groups. Considering reference panels comprising samples of recent African descent in Phase 3 of the HapMap Project, we identify mixtures of reference groups that produce the maximal imputation accuracy in each of the sampled populations. We find that optimal HapMap mixtures and maximal imputation accuracies identified in detailed tests of imputation procedures can instead be predicted by using simple summary statistics that measure relationships between the pattern of genetic variation in a target population and the patterns in potential reference panels. Our results provide an empirical basis for facilitating the selection of reference panels in GWA studies of diverse human populations, especially those of African ancestry.


Figures

Figure 1
Figure 1
Schematic world map of haplotype variation. (A) Haplotype sharing on the basis of the data from Pemberton et al. [2008]. (B) Haplotype sharing after including eight newly sampled African populations. The mean number of haplotypes per genomic core region in a sample size of 54 chromosomes is written for each geographic region. Links entering a geographic region indicate the percentages of distinct haplotypes from the geographic region found in other regions and are drawn proportionately in width. For example, in part A, on average 10% of haplotypes observed in Europe are found in Africa (18% in part B), whereas 6% of African haplotypes are found in Europe (10% in part B). The links can be viewed as a description of haplotype “flow”: for example, 10% (18%) gives a measurement of the proportion of distinct European haplotypes that could have come from Africa (without mutation or recombination), and 6% (10%) gives the proportion of African haplotypes that could have come from Europe. We used 1,800 core SNPs to generate the figure.
Figure 2
Figure 2
Numbers of private haplotypes. (A) The number of private haplotypes in each geographic region as a function of haplotype length. Sample sizes were adjusted to represent 54 chromosomes from each geographic region. (B) The number of private haplotypes in each African population as a function of haplotype length. Sample sizes were adjusted to represent 12 chromosomes from each population. Error bars represent the standard error of the mean across haplotype-loci.
Figure 3
Figure 3
Linkage disequilibrium (LD) vs. physical distance. r2 was calculated for each pair of SNPs with minor allele frequency greater than or equal to 0.05. The mean r2 within a bin is plotted as a function of the mean of the distance between pairs of SNPs within the bin. The bin size was 6 kb. Lines for individual populations are color-coded by geographic region.
Figure 4
Figure 4
The fraction of common haplotypes in individual populations that are also common in the HapMap. For each plot we used haplotypes based on the 517 SNPs that overlap between HapMap Phase 3 and our autosomal core regions on chromosome 21. We first averaged over all haplotype-loci within each core region and then averaged across the core regions for windows of a given length. Each curve shows the fraction of the common haplotypes of a population (with >10% frequency) that are also common in a HapMap sample. The lower right plot shows for each population the maximal sharing across the 11 HapMap samples, determined separately at each window size.
Figure 5
Figure 5
The fraction of common haplotypes in African populations that are also common in the HapMap. For each plot we used haplotypes based on the 517 SNPs that overlap between HapMap Phase 3 and our autosomal core regions on chromosome 21. We first averaged over all haplotype-loci within each core region and then averaged across the core regions for windows of a given length. Each curve shows the fraction of the common haplotypes of a population (with >10% frequency) that are also common in a HapMap sample formed by combining specific HapMap groups with recent African ancestry. Inside each plot that corresponds to one of the 15 HapMap mixtures, we label target populations in which the corresponding HapMap mixture served as the optimal reference panel among the 15 mixture panels. For the last plot of maximal haplotype sharing across HapMap mixtures, we label the populations with the highest and lowest maximal sharing fractions.
Figure 6
Figure 6
Imputation accuracy for inference of genotypes at hidden markers. For each target population specified by the column label, we masked a set of markers and imputed genotypes in the population using the reference population specified by the row label. Of 1,272 markers, 77, or ∼6%, were randomly chosen among a subset of 517 markers and masked, and for each target, the same set was masked for imputation with each reference population. The colors correspond to ten deciles of imputation accuracy across all populations and all reference panels. For each population, the best and second-best reference panels among 62 other populations are labeled 1 and 2, respectively. For convenience in interpreting the figure, the horizontal and vertical blue lines separate results by geographic region (from left to right and from bottom to top: Africa, Europe, Middle East, Central/South Asia, East Asia, Oceania, and the Americas).
Figure 7
Figure 7
Imputation accuracy for inference of genotypes at hidden markers, based on 15 reference panels consisting of combinations among four HapMap Phase 3 panels with recent African ancestry. For each target population, the bar represents the maximal imputation accuracy among the 15 choices, and it is colored according to the choice of optimal reference panel. Each HapMap panel was used with its original size in the combination panels. In each population, we masked the same 77, or ∼15%, of 517 markers as in Figure 6.
Figure 8
Figure 8
Imputation accuracy and statistics of genotypic and haplotypic variation. (A) Number of private haplotypes, (B) LD as measured by r2, (C) fraction of common haplotypes also common in the HapMap, and (D) Fst between a target population and its optimal HapMap mixture. The imputation accuracy represents the maximal imputation accuracy using the optimal panel among the 15 combinations of the HapMap panels of African descent (identical numerical values as plotted in Figure 7). All computations used the set of 517 SNPs that overlapped with HapMap Phase 3. In parts A and C, a window size of 50 kb was used; in part B, r2 was computed using a bin size of 6 kb; in part D, Fst was first computed for individual SNPs and was then averaged across the 517 SNPs. The fraction of common haplotypes also found in the HapMap and Fst were computed for target populations with their respective optimal panels among the 15 choices. The Pearson correlation coefficients are −0.66 (P = 0.0070) between imputation accuracy and number of private haplotypes, 0.15 (P = 0.6044) between imputation accuracy and r2, 0.79 (P = 0.0004) between imputation accuracy and fraction of common haplotypes in a target population also found in the HapMap, and −0.86 (P<0.0001) between imputation accuracy and Fst of a target population with its optimal HapMap mixture.
Figure 9
Figure 9
Imputation accuracy and the fraction of common haplotypes that are also common in the HapMap. For each target population, imputation accuracy using each of 15 HapMap mixture reference panels is plotted as a function of haplotype sharing with the reference panel (window size of 50 kb). The imputation accuracy for the optimal reference panel corresponds to the maximal imputation accuracy plotted in Figure 7.
Figure 10
Figure 10
Imputation accuracy and Fst with HapMap mixtures. For each target population, imputation accuracy using each of 15 HapMap mixture reference panels is plotted as a function of Fst with the reference panel. The imputation accuracy for the optimal reference panel corresponds to the maximal imputation accuracy plotted in Figure 7.

Similar articles

Cited by

References

    1. Adeyemo A, Gerry N, Chen G, Herbert A, Doumatey A, Huang H, Zhou J, Lashley K, Chen Y, Christman M, Rotimi C. A genome-wide association study of hypertension and blood pressure in African Americans. PLoS Genet. 2009;5:e1000564. - PMC - PubMed
    1. Bowcock AM, Ruiz-Linares A, Tomfohrde J, Minch E, Kidd JR, Cavalli-Sforza LL. High resolution of human evolutionary trees with polymorphic microsatellites. Nature. 1994;368:455–457. - PubMed
    1. Browning SR, Browning BL. Rapid and accurate haplotype phasing and missing-data inference for whole-genome association studies by use of localized haplotype clustering. Am J Hum Genet. 2007;81:1084–1097. - PMC - PubMed
    1. Browning BL, Browning SR. A unified approach to genotype imputation and haplotype-phase inference for large data sets of trios and unrelated individuals. Am J Hum Genet. 2009;84:210–223. - PMC - PubMed
    1. Bryc K, Auton A, Nelson MR, Oksenberg JR, Hauser SL, Williams S, Froment A, Bodo JM, Wambebe C, Tishkoff SA, Bustamante CD. Genome-wide patterns of population structure and admixture in West Africans and African Americans. Proc Natl Acad Sci USA. 2010;107:786–791. - PMC - PubMed

Publication types