Meta-Analysis
. 2011 Dec;35(8):809-22.
doi: 10.1002/gepi.20630.

Transethnic meta-analysis of genomewide association studies

Affiliations
Free PMC article
Meta-Analysis

Transethnic meta-analysis of genomewide association studies

Andrew P Morris. Genet Epidemiol. 2011 Dec.
Free PMC article

Abstract

The detection of loci contributing effects to complex human traits, and their subsequent fine-mapping for the location of causal variants, remains a considerable challenge for the genetics research community. Meta-analyses of genomewide association studies, primarily ascertained from European-descent populations, have made considerable advances in our understanding of complex trait genetics, although much of their heritability is still unexplained. With the increasing availability of genomewide association data from diverse populations, transethnic meta-analysis may offer an exciting opportunity to increase the power to detect novel complex trait loci and to improve the resolution of fine-mapping of causal variants by leveraging differences in local linkage disequilibrium structure between ethnic groups. However, we might also expect there to be substantial genetic heterogeneity between diverse populations, both in terms of the spectrum of causal variants and their allelic effects, which cannot easily be accommodated through traditional approaches to meta-analysis. In order to address this challenge, I propose novel transethnic meta-analysis methodology that takes account of the expected similarity in allelic effects between the most closely related populations, while allowing for heterogeneity between more diverse ethnic groups. This approach yields substantial improvements in performance, compared to fixed-effects meta-analysis, both in terms of power to detect association, and localization of the causal variant, over a range of models of heterogeneity between ethnic groups. Furthermore, when the similarity in allelic effects between populations is well captured by their relatedness, this approach has increased power and mapping resolution over random-effects meta-analysis.


Figures

Fig. 1
Fig. 1
Dendograms to represent the relatedness between five populations from diverse ethnic groups. Population codes: African American (AFR); European American (EUR); Latinos (LAT); Japanese Americans (JAP); and Native Hawaiians (HAW). Panel A corresponds to the prior model of relatedness between populations, constructed on the basis of mean allele frequency differences across 19 variants. Panel B corresponds to the posterior similarity between populations in terms of relatedness and allelic effect at rs7754840, constructed from the posterior probabilities that each pair of populations appear in the same cluster of the Bayesian partition model.
Fig. 2
Fig. 2
Dendogram to represent the relatedness between 11 diverse populations from Phase III of the International HapMap Project and the models of heterogeneity in allelic effects between them considered in the simulation study. Population codes: African ancestry in Southwest USA (ASW); Utah residents with North and Western European ancestry (CEU); Han Chinese in Beijing (CHB); Chinese in Metropolitan Denver (CHD); Gujarati Indians in Houston (GIH); Japanese in Tokyo (JPT); Luhya in Webuye, Kenya (LWK); Mexican ancestry in Los Angeles (MEX); Maasai in Kinyawa, Kenya (MKK); Toscani in Italy (TSI); and Yoruba in Ibadan, Nigeria (YRI). The relatedness between populations was measured by means of the mean allele frequency difference at 10,000 independent autosomal variants across the genome. The four models of heterogeneity are parameterised in terms of population-specific allelic effects, λ, and correspond to: (a) transethnic fixed-effect; (b) African-specific effect; (c) European and East Asian opposing effects; and (d) Western exposure effect.
Fig. 3
Fig. 3
Power of three MANTRA analyses (K = 1, K = N, and K unconstrained), as a function of the allelic effect size, to detect evidence in favor of association at the causal variant at a Bayes' factor of 105. Panels correspond to four models of heterogeneity in allelic effects between the populations: (A) transethnic fixed-effect; (B) African-specific effect; (C) European and East-Asian opposing effects; and (D) Western exposure effect.
Fig. 4
Fig. 4
Mean posterior probability of heterogeneity from the MANTRA analysis with K unconstrained, as a function of the allelic effect size. Panels correspond to four models of heterogeneity in allelic effects between the populations: (A) transethnic fixed-effect; (B) African-specific effect; (C) European and East-Asian opposing effects; and (D) Western exposure effect.
Fig. 5
Fig. 5
Mean location error (kb) of three MANTRA analyses (K = 1, K = N, and K unconstrained), as a function of the allelic effect size. Panels correspond to four models of heterogeneity in allelic effects between the populations: (A) transethnic fixed-effect; (B) African-specific effect; (C) European and East-Asian opposing effects; and (D) Western exposure effect.
Fig. 6
Fig. 6
Probability that the causal variant has the largest Bayes' factor in favor of association from three MANTRA analyses (K = 1, K = N, and K unconstrained), as a function of the allelic effect size. Panels correspond to four models of heterogeneity in allelic effects between the populations: (A) transethnic fixed-effect; (B) African-specific effect; (C) European and East-Asian opposing effects; and (D) Western exposure effect.
Fig. 7
Fig. 7
Summary of three MANTRA analyses (K = 1, K = N, and K unconstrained), as a function of the sample size of studies from populations of African descent (MKK, ASW, LWK and YRI). These simulations assume an African-specific effect of λ = 0.25. The three panels correspond to: (A) power to detect evidence in favor of association at the causal variant at a Bayes' factor of 105; (B) mean location error (kb); and (C) probability that the causal variant has the largest Bayes' factor in favor of association.
Fig. 8
Fig. 8
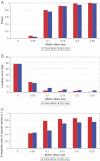
Summary of MANTRA analysis with K unconstrained, as a function of the allelic effect size, for 11 GWAS from the same CEU population compared with 11 GWAS from different transethnic populations. These simulations incorporate no heterogeneity in allelic effects between populations, i.e. a transethnic fixed-effect model. The three panels correspond to: (A) power to detect evidence in favor of association at the causal variant at a Bayes' factor of 105; (B) mean location error (kb); and (C) probability that the causal variant has the largest Bayes' factor in favor of association.

References

    1. Abnet CC, Freedman ND, Hu N, Wang Z, Yu K, Shu XO, Yuan JM, Zheng W, Dawsey SM, Dong LM, Lee MP, Ding T, Qiao YL, Gao YT, Koh WP, Xiang YB, Tang ZZ, Fan JH, Wang C, Wheeler W, Gail MH, Yeager M, Yuenger J, Hutchinson A, Jacobs KB, Giffen CA, Burdett L, Fraumeni JF, Jr, Tucker MA, Chow WH, Goldstein AM, Chanock SJ, Taylor PR. A shared susceptibility locus in PLCE1 at 10q23 for gastric adenocarcinoma and esophagael squanous cell carcinoma. Nat Genet. 2010;42:764–767. - PMC - PubMed
    1. Barrett JC, Clayton DG, Concannon P, Akolkar B, Cooper JD, Erlich HA, Julier C, Morahan G, Nerup J, Nierras C, Plagnol V, Pociot F, Schuilenburg H, Smyth DJ, Stevens H, Todd JA, Walker NM, Rich SS Type 1 Diabetes Genetics Consortium. Genome-wide association study and meta-analysis find that over 40 loci affect risk of type 1 diabetes. Nat Genet. 2009;41:703–707. - PMC - PubMed
    1. Chambers JC, Zhao J, Terracciano CM, Bezzina CR, Zhang W, Kaba R, Navaratnarajah M, Lotlikar A, Sehmi JS, Kooner MK, Deng G, Siedlecka U, Parasramka S, El-Hamamsy I, Wass MN, Dekker LR, de Jong JS, Sternberg MJ, McKenna W, Severs NJ, de Silva R, Wilde AA, Anand P, Yacoub M, Scott J, Elliott P, Wood JN, Kooner JS. Genetic variation in SCN10A influences cardiac conduction. Nat Genet. 2010;42:149–152. - PubMed
    1. Chen ZJ, Zhao H, He L, Shi Y, Qin Y, Shi Y, Li Z, You L, Zhao J, Liu J, Liang X, Zhao X, Zhao J, Sun Y, Zhang B, Jiang H, Zhao D, Bian Y, Gao X, Geng L, Li Y, Zhu D, Sun X, Xu JE, Hao C, Ren CE, Zhang Y, Chen S, Zhang W, Yang A, Yan J, Li Y, Ma J, Zhao Y. Genome-wide association study identifies susceptibility loci for polycystic ovary syndrome on chromosome 2p16.3, 2p21 and 9q33.3. Nat Genet. 2011;43:55–59. - PubMed
    1. Cooper RS, Tayo B, Zhu X. Genome-wide association studies: implications for multi-ethnic samples. Hum Mol Genet. 2008;17:R151–R155. - PMC - PubMed

Publication types

Substances