

Association between optic nerve blood flow and objective examinations in glaucoma patients with generalized enlargement disc type
- PMID: 22125400
- PMCID: PMC3218163
- DOI: 10.2147/OPTH.S22097
Association between optic nerve blood flow and objective examinations in glaucoma patients with generalized enlargement disc type
Abstract
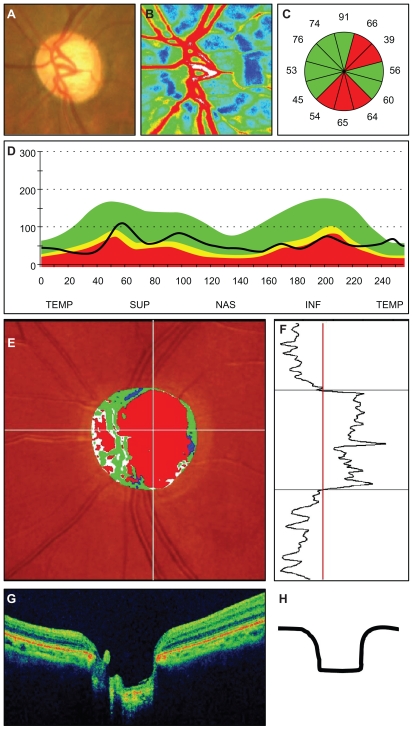
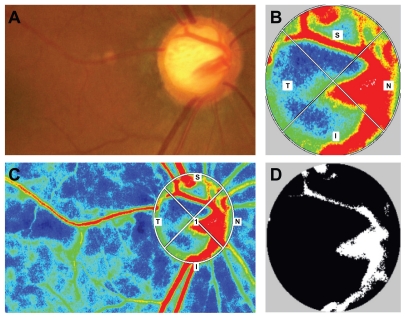
Background: The purpose of this study was to investigate the correlations between microcirculation in the optic disc, average peripapillary retinal nerve fiber layer thickness cupping parameters, and visual field defects in glaucoma patients with the generalized enlargement disc type.
Methods: A total of 38 eyes from 38 glaucoma patients with the generalized enlargement disc type were included. The microcirculation of the optic nerve head was examined with laser speckle flow graphy, and the mean blur rate in all areas, in vessel area, and in tissue area were calculated using the laser speckle flow graphy analyzer software. Average peripapillary retinal nerve fiber layer thickness was measured using Stratus optical coherence tomography, and cupping parameters were accessed using the Heidelberg retina tomograph. The mean deviation in the Humphrey field analyzer (30-2 SITA standard) was analyzed. The correlation between these parameters was evaluated using the Spearman rank correlation coefficient.
Results: The correlation coefficient of mean blur rate in all optic disc area to the average peripapillary retinal nerve fiber layer thickness, vertical C/D, and mean deviation were r = 0.7546 (P < 0.0001), r = -0.6208 (P < 0.0001), and r = 0.6010 (P = 0.0001), respectively. The mean blur rate in tissue area of the optic disc showed r = 0.7305 (P < 0.0001), r = -0.6438 (P < 0.0001), and r = 0.6338 (P < 0.0001).
Conclusion: We found that the mean blur rate in the optic disc was significantly correlated with the average peripapillary retinal nerve fiber layer thickness, vertical C/D, and mean deviation in patients with the generalized enlargement disc type of glaucoma. In particular, the mean blur rate in tissue area was more highly correlated than the vessel area with other results of examination in glaucoma patients with the generalized enlargement disc type.
Keywords: function; laser speckle flowgraphy; ocular blood flow; optic disc type; structure.
Figures
References
-
- Weinreb RN, Khaw PT. Primary open-angle glaucoma. Lancet. 2004;363:1711–1720. - PubMed
-
- Iwase A, Suzuki Y, Araie M, et al. The prevalence of primary open-angle glaucoma in Japanese: the Tajimi Study. Ophthalmology. 2004;111:1641–1648. - PubMed
-
- Cedrone C, Mancino R, Cerulli A, et al. Epidemiology of primary glaucoma: prevalence, incidence, and blinding effects. Prog Brain Res. 2008;173:3–14. - PubMed
LinkOut - more resources
Full Text Sources
