. 2011 Nov;7(11):e1002385.
doi: 10.1371/journal.pgen.1002385. Epub 2011 Nov 17.

Evidence-based annotation of gene function in Shewanella oneidensis MR-1 using genome-wide fitness profiling across 121 conditions

Affiliations

Evidence-based annotation of gene function in Shewanella oneidensis MR-1 using genome-wide fitness profiling across 121 conditions

Adam Deutschbauer et al. PLoS Genet. 2011 Nov.

Abstract

Most genes in bacteria are experimentally uncharacterized and cannot be annotated with a specific function. Given the great diversity of bacteria and the ease of genome sequencing, high-throughput approaches to identify gene function experimentally are needed. Here, we use pools of tagged transposon mutants in the metal-reducing bacterium Shewanella oneidensis MR-1 to probe the mutant fitness of 3,355 genes in 121 diverse conditions including different growth substrates, alternative electron acceptors, stresses, and motility. We find that 2,350 genes have a pattern of fitness that is significantly different from random and 1,230 of these genes (37% of our total assayed genes) have enough signal to show strong biological correlations. We find that genes in all functional categories have phenotypes, including hundreds of hypotheticals, and that potentially redundant genes (over 50% amino acid identity to another gene in the genome) are also likely to have distinct phenotypes. Using fitness patterns, we were able to propose specific molecular functions for 40 genes or operons that lacked specific annotations or had incomplete annotations. In one example, we demonstrate that the previously hypothetical gene SO_3749 encodes a functional acetylornithine deacetylase, thus filling a missing step in S. oneidensis metabolism. Additionally, we demonstrate that the orphan histidine kinase SO_2742 and orphan response regulator SO_2648 form a signal transduction pathway that activates expression of acetyl-CoA synthase and is required for S. oneidensis to grow on acetate as a carbon source. Lastly, we demonstrate that gene expression and mutant fitness are poorly correlated and that mutant fitness generates more confident predictions of gene function than does gene expression. The approach described here can be applied generally to create large-scale gene-phenotype maps for evidence-based annotation of gene function in prokaryotes.


Conflict of interest statement

The authors have declared that no competing interests exist.

Figures

Figure 1
Figure 1. A S. oneidensis MR-1 mutant fitness compendium.
(A) Parallel analysis of MR-1 mutant pools using TagModules. Only the uptags are used to interrogate strain abundance in the upPool, while the downtags are used exclusively to measure strain abundance in the dnPool. The Affymetrix TAG4 microarray illustrated here contains the complement sequences to both the uptags and downtags, therefore the abundance of all strains across both pools is assayed in a single hybridization. In the simple example diagrammed here, strain 3 in the upPool and strain 5 in the dnPool have fitness defects. We hybridize the tags both before (start) and after growth in selective media (condition). We calculate the fitness of a strain as the normalized log2 ratio of tag intensity of the condition relative to start. (B) Heatmap of the entire fitness dataset. Both genes and experiments were ordered by hierarchical clustering with Euclidean distance as the metric. A subset of the fitness heatmap for mutants in the general secretory pathway is expanded (bottom). (C) Fitness values for dnPool strains (x-axis) and upPool strains (y-axis) on DL-lactate defined media. “Same insertion” indicates identical mutant strains that are represented in both pools; “Other insertion, same gene” indicates independent transposon insertions in the same gene. The dashed line shows x = y. (D) Comparison of gene fitness values for pairs of genes predicted to be in the same operon . The data plotted reflects a single fitness experiment in DL-lactate minimal media, but the color-coding is derived from the entire fitness compendium: points in red are uncorrelated (r<0.3) across 195 fitness experiments. (E) Quality metrics for each of the 195 pool fitness experiments. r(Same) is the fitness correlation of identical mutant strains contained in both the upPool and dnPool (see red triangles in panel C). r(Operon) is the fitness correlation of adjacent genes predicted to the in the same operon (see panel D). (F) Comparison of DL-lactate minimal media pool fitness values (y-axis) and individual strain growth rates (x-axis) for 48 transposon mutants. Individual strain growth rates represent the average of at least three independent experiments. The vertical dotted line represents the growth rate of wild-type MR-1. The horizontal dotted line represents a pool fitness value for a neutral insertion. Some strains had long lag phases and a growth rate could not be calculated (green plus symbols).
Figure 2
Figure 2. Validation of mutant phenotypes by genetic complementation.
(A) Three conserved hypothetical genes are required for motility in an LB soft agar assay. MUT is a transposon mutant; MUT + empty is a transposon mutant carrying an empty plasmid, MUT + comp is a transposon mutant with a plasmid carrying an intact copy of the mutated gene. SO_2650 has no known domains. SO_3273 (protein of unknown function DUF115) contains a tetratricopeptide-like helical domain (IPR011990), a common structural motif. SO_3257 is discussed in the main text. (B) SO_1071 is a predicted membrane protein from an uncharacterized protein family (UPF0016). It is required for growth in minimal media with DL-lactate as a carbon source. (C) Same as (B) for SO_4544, a hypothetical protein with no known domains. (D) Same as (B) for SO_0274 (ppc) encoding phosphoenolpyruvate carboxylase. (E) SO_1916, a transcriptional regulator, is required for maximal anaerobic growth with DL-lactate as a carbon source and DMSO as an electron acceptor (also see Figure S4). (F) SO_0887, annotated as agmatine deiminase, is required for maximal growth on minimal media with gelatin as a carbon source. (G) SO_1371 is a conserved hypothetical gene, contains an RDD domain (one arginine and two aspartates), and is a predicted membrane protein. It is required for maximal growth on minimal media with acetate as a carbon source. (H) Same as (G) for SO_1333, a conserved hypothetical gene. SO_1333 is a distant homolog of the sulfoacetate transporter TauE .
Figure 3
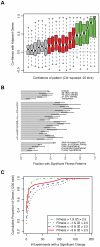
Figure 3. A phenotype for more than 2,000 genes in S. oneidensis MR-1.
(A) Genes with more significant fitness patterns (higher chi-squared) tend to have stronger correlations with other genes in the same operon. We divided the genes into 20 bins by the significance (chi-squared) of their fitness patterns and for each bin we show a box plot of the correlations of those genes with adjacent genes that are predicted to be co-transcribed. The box shows the median and the interquartile range; the whiskers show the extreme values; and the indentations show the 90% confidence interval of the median. Red and green bins have statistically significant chi-squared scores (P<0.001). Dashed lines are at 0 (random) and 0.4 (highly significant cofitness; P<1e-8). (B) The proportion of different kinds of genes that have strong fitness patterns (N = 1,230; see main text). The single letter codes are COG function codes: C (Energy production and conversion), D (Cell cycle control, cell division, chromosome partitioning), E (Amino acid transport and metabolism), F (Nucleotide transport and metabolism), G (Carbohydrate transport and metabolism), H (Coenzyme transport and metabolism), I (Lipid transport and metabolism), J (Translation, ribosomal structure and biogenesis), K (Transcription), L (Replication, recombination and repair), M (Cell wall/membrane/envelope biogenesis), N (Cell motility), O (Posttranslational modification, protein turnover, chaperones), P (Inorganic ion transport and metabolism), Q (Secondary metabolites biosynthesis, transport and catabolism), R (General function prediction only), S (Function unknown), T (Signal transduction mechanisms), U (Intracellular trafficking, secretion, and vesicular transport), and V (Defense mechanisms). Unique genes (top of panel) are those without a homolog in the MR-1 genome at greater than 30% amino acid identity. The error bars are 90% confidence intervals. (C) The cumulative proportion of all genes with strong fitness patterns (N = 1,230) versus the number of experiments with a significant change. Here we define a significant change as |Fitness|>1 and |Z|>2.5. Four classes of significant change are plotted; fitness defects of varying severity or positive fitness. For example, ∼40% of the 1,230 genes do not have a severe fitness defect (Fitness<−3) in any of the 195 conditions despite having a strong fitness pattern and 80% of genes with a severe fitness defect (Fitness<−3) have that phenotype in 10 experiments or less.
Figure 4
Figure 4. SO_3749 encodes a functional N-acetyl-ornithine deacetylase.
(A) Fitness heatmap for genes of the arginine biosynthesis pathway and SO_3749, annotated as a hypothetical protein. (B) Growth of wild-type MR-1 and a SO_3749 transposon mutant on minimal media with DL-lactate as a carbon source. The auxotrophy of the SO_3749 mutant is complemented by the E. coli argE gene (bottom right). (C) Same as (B) for wild-type E. coli and an argE deletion mutant. The auxotrophy of the E. coli argE mutant is complemented by MR-1 SO_3749 (bottom right).
Figure 5
Figure 5. SO_2648 and SO_2742 activate acs.
(A) Fitness pattern of histidine kinase SO_2742, response regulator SO_2648, and acetyl-coA synthetase (acs). SO_2742 and SO_2648 have highly correlated fitness patterns over the entire compendium. The color code for experiments is identical to that in Figure 1B. (B) Comparison of genome-wide expression in mutants of SO_2648 and SO_2742. RNA samples for both mutants and wild-type were collected one hour after transfer to a minimal media with acetate as the carbon source. The expression of both mutants is plotted as the log2 ratio of mutant versus wild-type. The expression of acs is marked with an X. (C) Relative expression of acs in different transcription factor mutants and conditions. For each mutant, the expression level is relative to wild-type MR-1 grown in the identical condition. Lactate/DMSO is one hour after transfer to anaerobic minimal media with DL-lactate as a carbon source and DMSO as an electron acceptor, acetate/O2 is one hour after transfer to aerobic minimal media with acetate as a carbon source, and lactate/O2 is aerobic exponential growth in DL-lactate minimal media.
Figure 6
Figure 6. Gene expression and mutant fitness are poorly correlated.
(A) Comparison of gene expression and mutant fitness in LB (rich media) versus minimal media with DL-lactate as a carbon source. Relative expression is a comparison of gene expression for wild-type MR-1 in exponential growth in the two conditions. Relative fitness is the difference of pooled fitness values for the two conditions. Both relative fitness and expression values are log2 ratios. For example, genes on the bottom right of the plot are up-regulated in expression in DL-lactate minimal media relative to LB and are more important for fitness in DL-lactate minimal media than in LB. Therefore, a correlation of -1 would be a perfect correlation between mutant fitness and gene expression. FBA auxotrophs are predicted from flux balance analysis ; TIGR auxotrophs are predicted from TIGR functional roles . (B) Same as (A) for minimal media with DL-lactate and N-acetyl-glucosamine (NAG) as carbon sources. Gene codes correspond to edd (SO_2487; phosphogluconate dehydratase), zwf (SO_2489; glucose-6-phosphate 1-dehydrogenase), and nag (nagP (SO_3503), nagA (SO_3505), nagB-II (SO_3506), nagK-I (SO_3507), and nagR (SO_3516)). The NAG genes were annotated by Osterman and colleagues . Sick on LB or edge indicates if a gene is sick on LB (which means that the gene is likely sick in many conditions) or insertions for that gene are only on the edge (not within the central 5–80% portion of the protein). (C) Same as (A) for minimal media with DL-lactate and acetate as carbon sources. Gene codes correspond to L-lactate dehydrogenase (SO_1518:SO_1519), pyruvate dehydrogenase (SO_0424:SO_0425), ccm – cytochrome c maturation (SO_0259:SO_0268), cytochrome c electron transport genes (SO_2357:SO_2364; SO_0608:SO_0610), and TCA cycle and related genes (SO_0770, SO_1483:SO_1484, SO_2339:SO_2341, SO_3855).
Figure 7
Figure 7. Mutant fitness gives confident predictions of gene function.
(A) We used 195 fitness experiments to predict TIGR functional groups or subroles. We show the distribution of confidence values for correct and incorrect predictions for the 618 genes with subroles assigned by TIGR and also the distribution of confidence values for the 2,629 genes that were not assigned subroles by TIGR (in green; marked as unknown). The confidence of correct predictions is significantly better than for the incorrect predictions (Kolmogorov-Smirnov test; D = 0.50, P-value<1e−15). (B) Same as (A) but using 371 microarray gene expression experiments. (C) Same as (A) but using both 195 pooled fitness experiments and 371 gene expression experiments.
Figure 8
Figure 8. Expression and fitness are both informative about gene regulation.
(A) Coexpression of transcription factors and their predicted target genes. All transcription factor-target gene pairs are derived from the manually curated RegPrecise database . We excluded autoregulatory pairs from both the RegPrecise gene pairs and the shuffled controls. The same 371 expression experiments described in Figure 7B are used. (B) Same as A, using cofitness rather than coexpression. For fitness correlations, the entire fitness compendium of 195 experiments was used.

Similar articles

Cited by

References

    1. Galperin MY, Koonin EV. From complete genome sequence to ‘complete’ understanding? Trends Biotechnol. 2010;28:398–406. - PMC - PubMed
    1. Keseler IM, Collado-Vides J, Santos-Zavaleta A, Peralta-Gil M, Gama-Castro S, et al. EcoCyc: a comprehensive database of Escherichia coli biology. Nucleic Acids Res. 2011;39:D583–590. - PMC - PubMed
    1. Roberts RJ, Chang YC, Hu Z, Rachlin JN, Anton BP, et al. COMBREX: a project to accelerate the functional annotation of prokaryotic genomes. Nucleic Acids Res. 2011;39:D11–14. - PMC - PubMed
    1. Rost B. Enzyme function less conserved than anticipated. J Mol Biol. 2002;318:595–608. - PubMed
    1. Price MN, Dehal PS, Arkin AP. Orthologous transcription factors in bacteria have different functions and regulate different genes. PLoS Comput Biol. 2007;3:e175. doi: 10.1371/journal.pcbi.0030175. - DOI - PMC - PubMed

Publication types

Substances