

doi: 10.3389/fncom.2011.00053.
eCollection 2011.
A Biologically Plausible Transform for Visual Recognition that is Invariant to Translation, Scale, and Rotation
Affiliations
- PMID: 22125522
- PMCID: PMC3222220
- DOI: 10.3389/fncom.2011.00053
Item in Clipboard
A Biologically Plausible Transform for Visual Recognition that is Invariant to Translation, Scale, and Rotation
Front Comput Neurosci.
.
Abstract
Visual object recognition occurs easily despite differences in position, size, and rotation of the object, but the neural mechanisms responsible for this invariance are not known. We have found a set of transforms that achieve invariance in a neurally plausible way. We find that a transform based on local spatial frequency analysis of oriented segments and on logarithmic mapping, when applied twice in an iterative fashion, produces an output image that is unique to the object and that remains constant as the input image is shifted, scaled, or rotated.
Keywords: biological classifier; cortico-striatal; hierarchical; hybrid model; reinforcement; unsupervised.
Figures
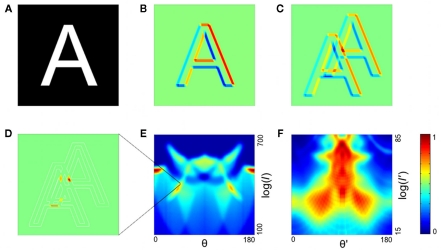
The two-stage transformation. (A,B) In the first step of the first stage, edge detection is performed, illustrated for an orientation of 45° in (B) (red, positive values; blue, negative). (C,D) The second step of the transform is a spatial interval detector looking for edges separated by interval I at the same angle as the interval detector. To achieve this, the image is shifted (C), and the pixel values are multiplied, with negative values set to zero (D). (E) The image in (D) is summed over all positions to yield a single point in the log interval vs. orientation map (and similarly for other orientations and intervals; orientation range 0–180; interval range 100–700 pixels). Color code is at far right; this is linear with dark blue as zero. (F) In the second stage, the same transform is applied again, yielding a map whose coordinates are log I′ and θ′ (defined relative to the axes of the stage 1 output; interval range 15–85 pixels). Color code is at right; this is linear with dark blue as zero.
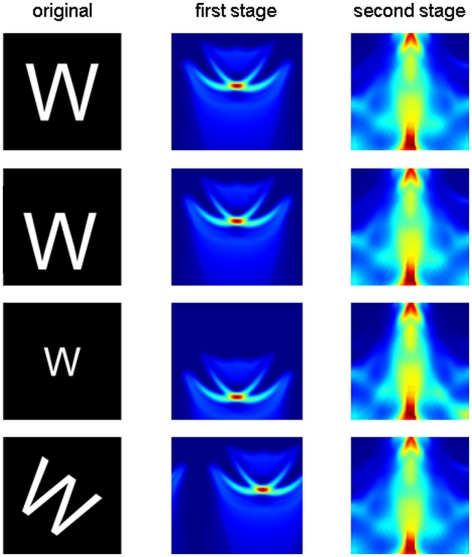
The two-stage transform produces an output invariant to translation, scale, and rotation. First column: the letter W is translated (second row), scaled (third row), or rotated (fourth row). Second column: first-stage output. Third column: second-stage output. Axes and color code are as in Figure 1E,F respectively.
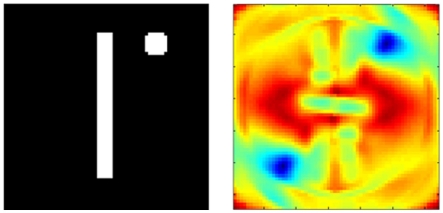
The two-stage transform provides a unique description of the object. The object in the left panel (line and dot) was varied by moving the dot exhaustively to all positions in the panel. For each position, the two-stage transform was applied. The difference in output from the pattern at left was computed as a Euclidian distance and color coded (red, most different; blue, most similar). The only similar output (blue region at bottom left) is produced by a rotation of the original image.
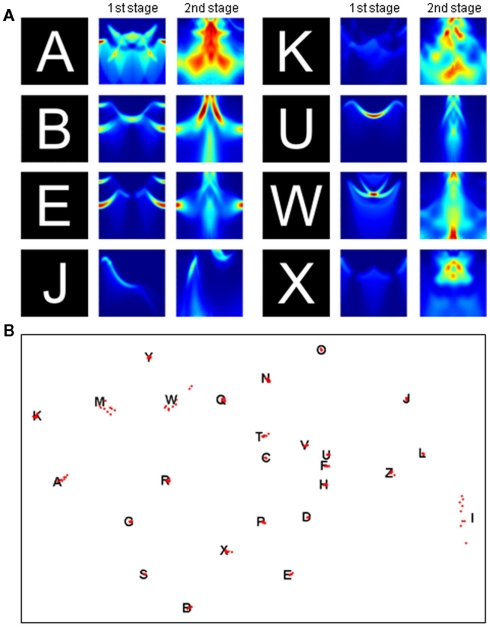
Output of the two-stage transform is sufficient for object recognition. (A) First- and second-stage transforms for various letters. Axes and color code as in Figure 1E,F. (B) To test recognition, the transform of nine rotated and scaled versions of each letter was compared to the transform of the parent letter. The distances between the 26 parent letters (black letters) and 234 rotated and scaled versions (red dots) are approximately rendered in two dimensions by multidimensional scaling (see Materials and Methods).
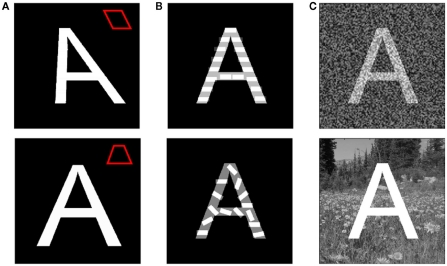
Letter identification is resistant to perturbations of the image. Different perturbations were gradually applied to the letter A until the resulting image was not correctly recognized by the linear classifier. Panels depict the maximum amount of perturbation before misidentification occurred. (A) Distortion of the letter shape. Insets illustrate the effect of the distortion on an outlined square. Top: horizontal shear. Bottom: foreshortening due to perspective. (B) Texture superposition. The images were generated by linearly mixing the source image and an image composed of horizontal (top) or randomly oriented (bottom) bars. (C) Whole image manipulation. Top: White noise was added to every pixel of the source image, followed by normalization of the image pixel intensity to span the range 0–1. The blending of the source image and the noise was varied. Bottom: The black background of the source image was replaced by an image of a natural scene with different levels of mean intensity.
Similar articles
-
A model for size- and rotation-invariant pattern processing in the visual system.Biol Cybern. 1984;51(2):113-21. doi: 10.1007/BF00357924. Biol Cybern. 1984. PMID: 6509123
-
Invariance of object detection in untrained deep neural networks.Front Comput Neurosci. 2022 Nov 3;16:1030707. doi: 10.3389/fncom.2022.1030707. eCollection 2022. Front Comput Neurosci. 2022. PMID: 36405785 Free PMC article.
-
A hybrid learning network for shift-invariant recognition.Neural Netw. 2001 Oct;14(8):1061-73. doi: 10.1016/s0893-6080(01)00063-6. Neural Netw. 2001. PMID: 11681751
-
Learning Invariant Object and Spatial View Representations in the Brain Using Slow Unsupervised Learning.Front Comput Neurosci. 2021 Jul 21;15:686239. doi: 10.3389/fncom.2021.686239. eCollection 2021. Front Comput Neurosci. 2021. PMID: 34366818 Free PMC article. Review.
-
Achieving visual object constancy across plane rotation and depth rotation.Acta Psychol (Amst). 1999 Sep;102(2-3):221-45. doi: 10.1016/s0001-6918(98)00052-3. Acta Psychol (Amst). 1999. PMID: 10504882 Review.
Cited by
-
The ripple pond: enabling spiking networks to see.Front Neurosci. 2013 Nov 15;7:212. doi: 10.3389/fnins.2013.00212. eCollection 2013. Front Neurosci. 2013. PMID: 24298234 Free PMC article.
-
Deep supervised, but not unsupervised, models may explain IT cortical representation.PLoS Comput Biol. 2014 Nov 6;10(11):e1003915. doi: 10.1371/journal.pcbi.1003915. eCollection 2014 Nov. PLoS Comput Biol. 2014. PMID: 25375136 Free PMC article.
-
The challenge of understanding the brain: where we stand in 2015.Neuron. 2015 May 20;86(4):864-882. doi: 10.1016/j.neuron.2015.03.032. Neuron. 2015. PMID: 25996132 Free PMC article. Review.
-
Modeling invariant object processing based on tight integration of simulated and empirical data in a Common Brain Space.Front Comput Neurosci. 2012 Mar 9;6:12. doi: 10.3389/fncom.2012.00012. eCollection 2012. Front Comput Neurosci. 2012. PMID: 22408617 Free PMC article.
References
Grants and funding
LinkOut - more resources
Full Text Sources