

Heart Rate Variability during Simulated Hemorrhage with Lower Body Negative Pressure in High and Low Tolerant Subjects
- PMID: 22125539
- PMCID: PMC3221414
- DOI: 10.3389/fphys.2011.00085
Heart Rate Variability during Simulated Hemorrhage with Lower Body Negative Pressure in High and Low Tolerant Subjects
Abstract
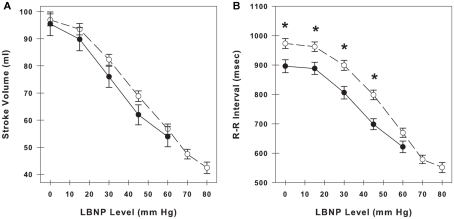
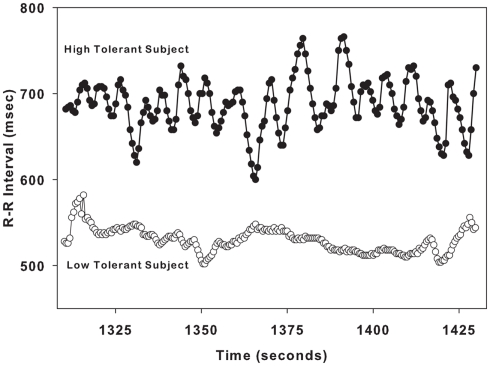
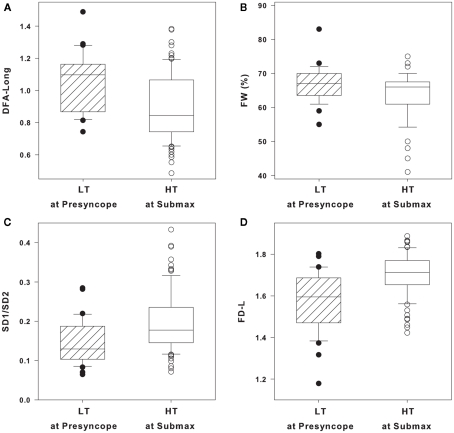
Heart rate variability (HRV) decreases during hemorrhage, and has been proposed as a new vital sign to assess cardiovascular stability in trauma patients. The purpose of this study was to determine if any of the HRV metrics could accurately distinguish between individuals with different tolerance to simulated hemorrhage. Specifically, we hypothesized that (1) HRV would be similar in low tolerant (LT) and high tolerant (HT) subjects at presyncope when both groups are on the verge of hemodynamic collapse; and (2) HRV could distinguish LT subjects at presyncope from hemodynamically stable HT subjects (i.e., at a submaximal level of hypovolemia). Lower body negative pressure (LBNP) was used as a model of hemorrhage in healthy human subjects, eliciting central hypovolemia to the point of presyncopal symptoms (onset of hemodynamic collapse). Subjects were classified as LT if presyncopal symptoms occurred during the -15 to -60 mmHg levels of LBNP, and HT if symptoms occurred after LBNP of -60 mmHg. A total of 20 HRV metrics were derived from R-R interval measurements at the time of presyncope, and at one level prior to presyncope (submax) in LT and HT groups. Only four HRV metrics (Long-range Detrended Fluctuation Analysis, Forbidden Words, Poincaré Plot Descriptor Ratio, and Fractal Dimensions by Curve Length) supported both hypotheses. These four HRV metrics were evaluated further for their ability to identify individual LT subjects at presyncope when compared to HT subjects at submax. Variability in individual LT and HT responses was so high that LT responses overlapped with HT responses by 85-97%. The sensitivity of these HRV metrics to distinguish between individual LT from HT subjects was 6-33%, and positive predictive values were 40-73%. These results indicate that while a small number of HRV metrics can accurately distinguish between LT and HT subjects using group mean data, individual HRV values are poor indicators of tolerance to hypovolemia.
Keywords: heart period variability; heart rate variability; hemorrhage; hypovolemia; lower body negative pressure.
Figures
Similar articles
-
Cardio-respiratory interactions in response to lower-body negative pressure.Physiol Meas. 2023 Feb 28;44(2). doi: 10.1088/1361-6579/acb7c6. Physiol Meas. 2023. PMID: 36720165
-
Time course of compensatory physiological responses to central hypovolemia in high- and low-tolerant human subjects.Am J Physiol Regul Integr Comp Physiol. 2018 Aug 1;315(2):R408-R416. doi: 10.1152/ajpregu.00361.2017. Epub 2018 Apr 18. Am J Physiol Regul Integr Comp Physiol. 2018. PMID: 29668322
-
The role of cerebral oxygenation and regional cerebral blood flow on tolerance to central hypovolemia.Am J Physiol Regul Integr Comp Physiol. 2016 Feb 15;310(4):R375-83. doi: 10.1152/ajpregu.00367.2015. Epub 2015 Dec 16. Am J Physiol Regul Integr Comp Physiol. 2016. PMID: 26676249
-
The reciprocal relationship between cardiac baroreceptor sensitivity and cerebral autoregulation during simulated hemorrhage in humans.Auton Neurosci. 2022 Sep;241:103007. doi: 10.1016/j.autneu.2022.103007. Epub 2022 Jun 11. Auton Neurosci. 2022. PMID: 35716525 Free PMC article. Review.
-
Lightweight noninvasive trauma monitor for early indication of central hypovolemia and tissue acidosis: a review.J Trauma Acute Care Surg. 2012 Aug;73(2 Suppl 1):S106-11. doi: 10.1097/TA.0b013e318260a928. J Trauma Acute Care Surg. 2012. PMID: 22847078 Review.
Cited by
-
Heart rate variability and pulmonary dysfunction in rats subjected to hemorrhagic shock.BMC Cardiovasc Disord. 2020 Jul 11;20(1):331. doi: 10.1186/s12872-020-01606-x. BMC Cardiovasc Disord. 2020. PMID: 32652932 Free PMC article.
-
Normothermic central hypovolemia tolerance reflects hyperthermic tolerance.Clin Auton Res. 2014 Jun;24(3):119-26. doi: 10.1007/s10286-014-0237-y. Epub 2014 Apr 4. Clin Auton Res. 2014. PMID: 24700256 Free PMC article. Clinical Trial.
-
Assessment of the brain ischemia during orthostatic stress and lower body negative pressure in air force pilots by near-infrared spectroscopy.Biomed Opt Express. 2020 Jan 23;11(2):1043-1060. doi: 10.1364/BOE.377779. eCollection 2020 Feb 1. Biomed Opt Express. 2020. PMID: 32133236 Free PMC article.
-
Classification of Blood Volume Decompensation State via Machine Learning Analysis of Multi-Modal Wearable-Compatible Physiological Signals.Sensors (Basel). 2022 Feb 10;22(4):1336. doi: 10.3390/s22041336. Sensors (Basel). 2022. PMID: 35214238 Free PMC article.
-
Blood Pressure and Heart Rate Response to Orthostasis in Somali Americans.Res Sq [Preprint]. 2024 Oct 21:rs.3.rs-4925722. doi: 10.21203/rs.3.rs-4925722/v1. Res Sq. 2024. Update in: J Racial Ethn Health Disparities. 2025 Mar 15. doi: 10.1007/s40615-025-02389-7. PMID: 39502777 Free PMC article. Updated. Preprint.
References
-
- Bellamy R. F. (1984). The causes of death in conventional land warfare: implications for combat casualty care research. Mil. Med. 149, 55–62 - PubMed
LinkOut - more resources
Full Text Sources
Other Literature Sources