

Microsecond molecular dynamics simulations of intrinsically disordered proteins involved in the oxidative stress response
- PMID: 22125611
- PMCID: PMC3220680
- DOI: 10.1371/journal.pone.0027371
Microsecond molecular dynamics simulations of intrinsically disordered proteins involved in the oxidative stress response
Abstract
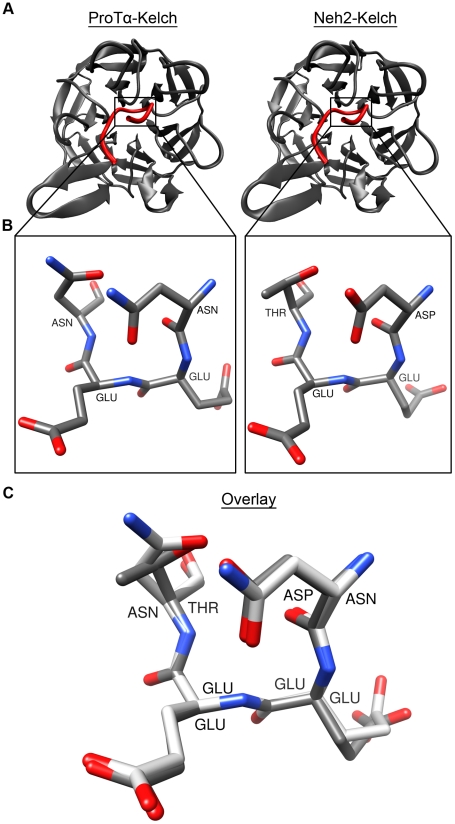
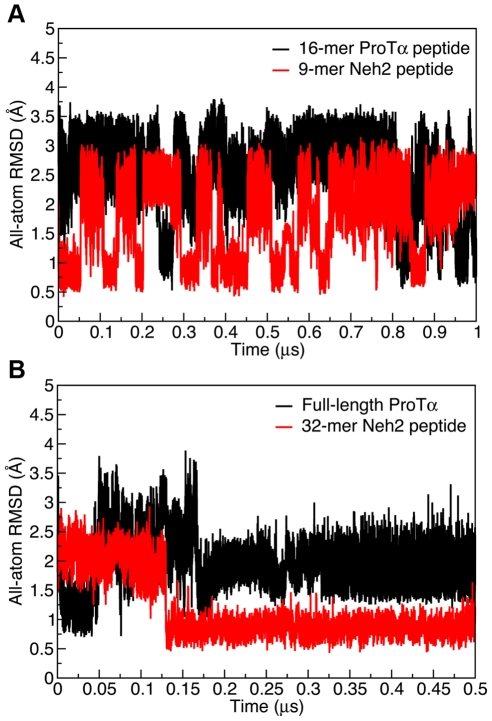
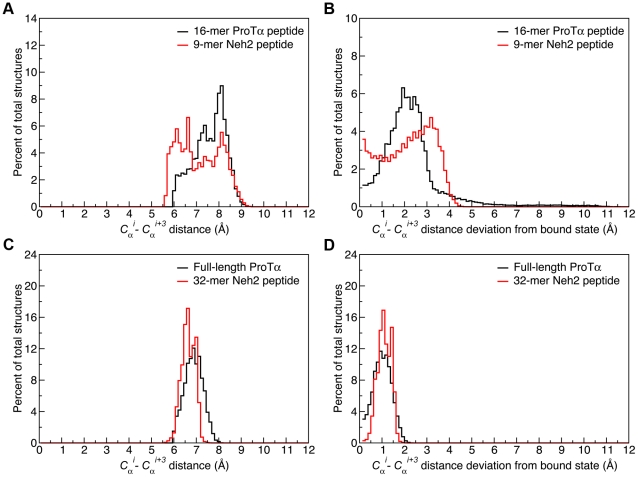
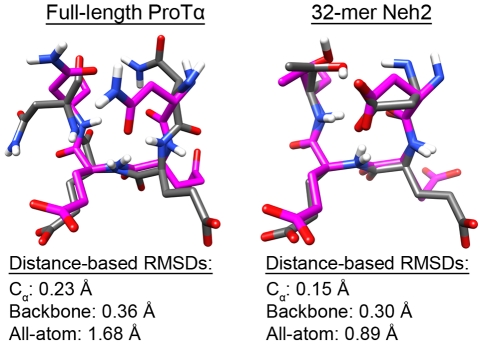
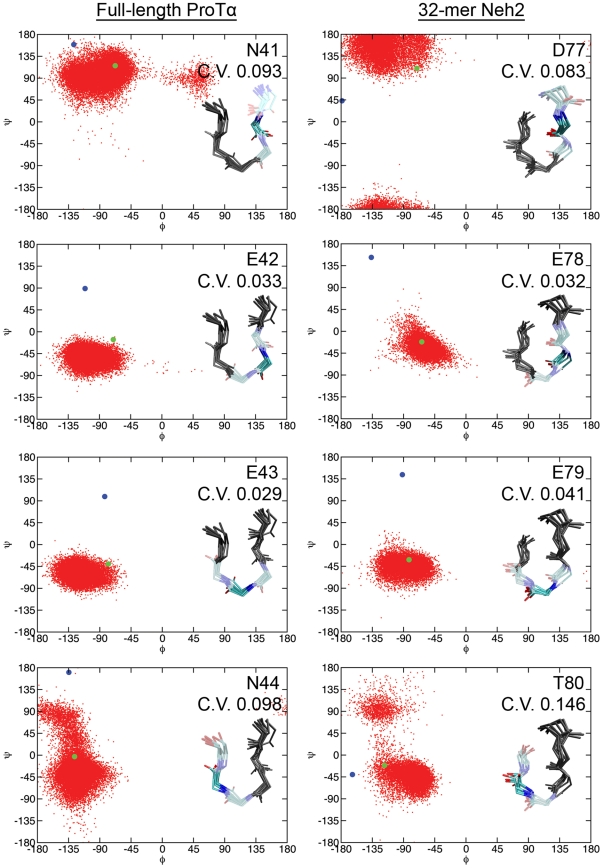
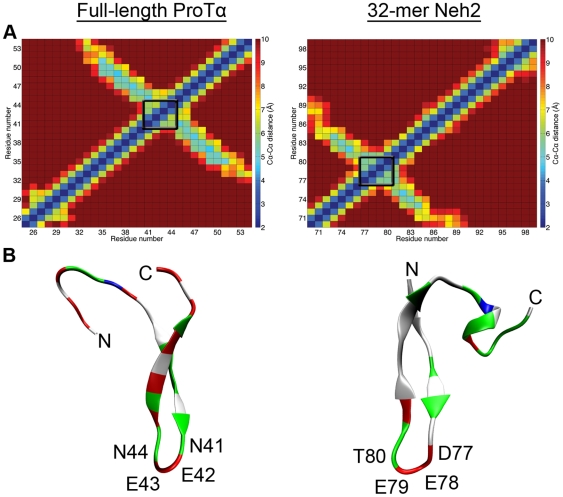
Intrinsically disordered proteins (IDPs) are abundant in cells and have central roles in protein-protein interaction networks. Interactions between the IDP Prothymosin alpha (ProTα) and the Neh2 domain of Nuclear factor erythroid 2-related factor 2 (Nrf2), with a common binding partner, Kelch-like ECH-associated protein 1(Keap1), are essential for regulating cellular response to oxidative stress. Misregulation of this pathway can lead to neurodegenerative diseases, premature aging and cancer. In order to understand the mechanisms these two disordered proteins employ to bind to Keap1, we performed extensive 0.5-1.0 microsecond atomistic molecular dynamics (MD) simulations and isothermal titration calorimetry experiments to investigate the structure/dynamics of free-state ProTα and Neh2 and their thermodynamics of bindings. The results show that in their free states, both ProTα and Neh2 have propensities to form bound-state-like β-turn structures but to different extents. We also found that, for both proteins, residues outside the Keap1-binding motifs may play important roles in stabilizing the bound-state-like structures. Based on our findings, we propose that the binding of disordered ProTα and Neh2 to Keap1 occurs synergistically via preformed structural elements (PSEs) and coupled folding and binding, with a heavy bias towards PSEs, particularly for Neh2. Our results provide insights into the molecular mechanisms Neh2 and ProTα bind to Keap1, information that is useful for developing therapeutics to enhance the oxidative stress response.
Conflict of interest statement
Figures
Similar articles
-
Fuzzy complex formation between the intrinsically disordered prothymosin α and the Kelch domain of Keap1 involved in the oxidative stress response.J Mol Biol. 2013 Mar 25;425(6):1011-27. doi: 10.1016/j.jmb.2013.01.005. Epub 2013 Jan 11. J Mol Biol. 2013. PMID: 23318954
-
Keap1 recruits Neh2 through binding to ETGE and DLG motifs: characterization of the two-site molecular recognition model.Mol Cell Biol. 2006 Apr;26(8):2887-900. doi: 10.1128/MCB.26.8.2887-2900.2006. Mol Cell Biol. 2006. PMID: 16581765 Free PMC article.
-
Structural analysis of the complex of Keap1 with a prothymosin alpha peptide.Acta Crystallogr Sect F Struct Biol Cryst Commun. 2008 Apr 1;64(Pt 4):233-8. doi: 10.1107/S1744309108004995. Epub 2008 Mar 21. Acta Crystallogr Sect F Struct Biol Cryst Commun. 2008. PMID: 18391415 Free PMC article.
-
Evolutionary conserved N-terminal domain of Nrf2 is essential for the Keap1-mediated degradation of the protein by proteasome.Arch Biochem Biophys. 2005 Jan 15;433(2):342-50. doi: 10.1016/j.abb.2004.10.012. Arch Biochem Biophys. 2005. PMID: 15581590 Review.
-
Discovery of the negative regulator of Nrf2, Keap1: a historical overview.Antioxid Redox Signal. 2010 Dec 1;13(11):1665-78. doi: 10.1089/ars.2010.3222. Epub 2010 Jul 13. Antioxid Redox Signal. 2010. PMID: 20446768 Review.
Cited by
-
Voghera Sweet Pepper: A Potential Ally against Oxidative Stress and Aging.Int J Mol Sci. 2023 Feb 14;24(4):3782. doi: 10.3390/ijms24043782. Int J Mol Sci. 2023. PMID: 36835192 Free PMC article.
-
Integrative structural dynamics probing of the conformational heterogeneity in synaptosomal-associated protein 25.Cell Rep Phys Sci. 2021 Nov 17;2(11):100616. doi: 10.1016/j.xcrp.2021.100616. Epub 2021 Oct 15. Cell Rep Phys Sci. 2021. PMID: 34888535 Free PMC article.
-
KEAP1-NRF2 Interaction in Cancer: Competitive Interactors and Their Role in Carcinogenesis.Cancers (Basel). 2025 Jan 28;17(3):447. doi: 10.3390/cancers17030447. Cancers (Basel). 2025. PMID: 39941813 Free PMC article. Review.
-
A Molecular Dynamics Study on Rotational Nanofluid and Its Application to Desalination.Membranes (Basel). 2020 Jun 6;10(6):117. doi: 10.3390/membranes10060117. Membranes (Basel). 2020. PMID: 32517208 Free PMC article.
-
The transition state structure for coupled binding and folding of disordered protein domains.Sci Rep. 2013;3:2076. doi: 10.1038/srep02076. Sci Rep. 2013. PMID: 23799450 Free PMC article.
References
-
- Dyson HJ, Wright PE. Intrinsically unstructured proteins and their functions. Nat Rev Mol Cell Biol. 2005;6:197–208. - PubMed
-
- Dunker AK, Lawson JD, Brown CJ, Williams RM, Romero P, et al. Intrinsically disordered protein. J Mol Graph Model. 2001;19:26–59. - PubMed
-
- Wright PE, Dyson HJ. Intrinsically unstructured proteins: re-assessing the protein structure-function paradigm. J Mol Biol. 1999;293:321–331. - PubMed
-
- Dunker AK, Garner E, Guilliot S, Romero P, Albrecht K, et al. Pac Symp Biocomput; 1998. Protein disorder and the evolution of molecular recognition: theory, predictions and observations. pp. 473–484. - PubMed
Publication types
MeSH terms
Substances
Grants and funding
LinkOut - more resources
Full Text Sources
Molecular Biology Databases
Research Materials
