. 2011;6(11):e27454.
doi: 10.1371/journal.pone.0027454. Epub 2011 Nov 18.

Automated analysis of time-lapse imaging of nuclear translocation by retrospective strategy and its application to STAT1 in HeLa cells

Affiliations

Automated analysis of time-lapse imaging of nuclear translocation by retrospective strategy and its application to STAT1 in HeLa cells

Fujun Han et al. PLoS One. 2011.

Abstract

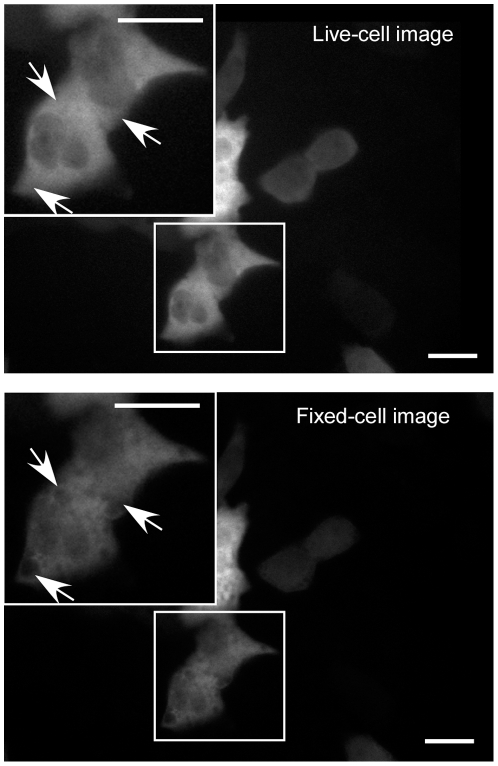
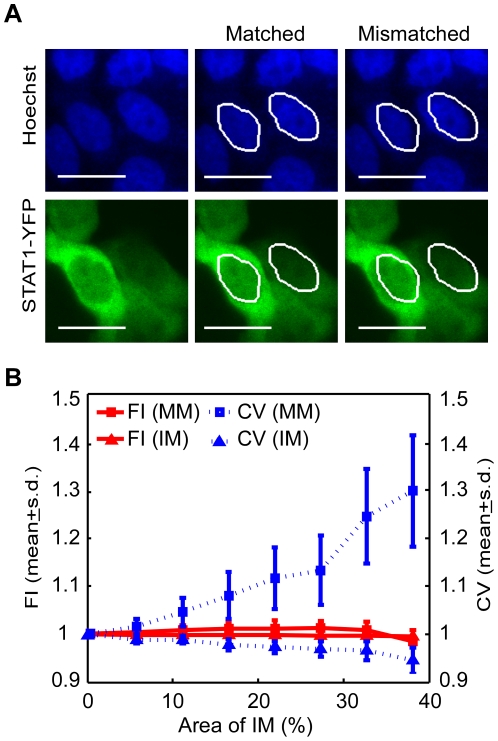
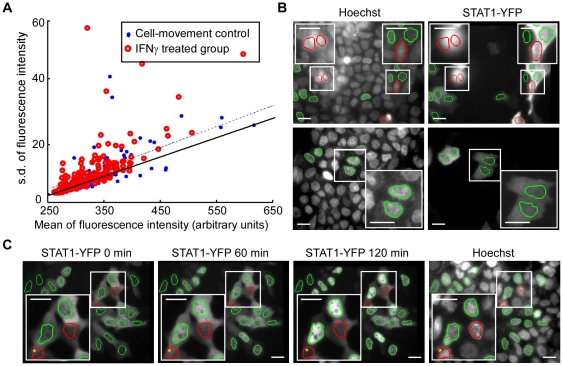
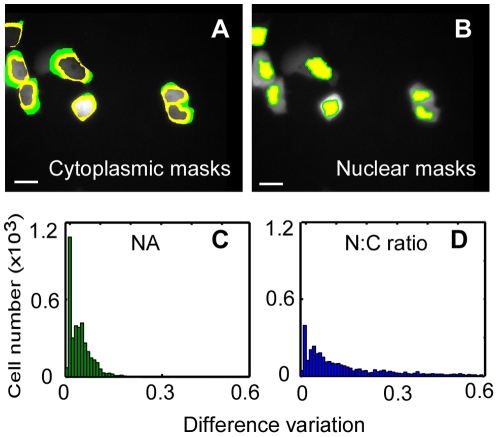
Cell-based image analysis of time-lapse imaging is mainly challenged by faint fluorescence and dim boundaries of cellular structures of interest. To resolve these bottlenecks, a novel method was developed based on "retrospective" analysis for cells undergoing minor morphological changes during time-lapse imaging. We fixed and stained the cells with a nuclear dye at the end of the experiment, and processed the time-lapse images using the binary masks obtained by segmenting the nuclear-stained image. This automated method also identifies cells that move during the time-lapse imaging, which is a factor that could influence the kinetics measured for target proteins that are present mostly in the cytoplasm. We then validated the method by measuring interferon gamma (IFNγ) induced signal transducers and activators of transcription 1 (STAT1) nuclear translocation in living HeLa cells. For the first time, automated large-scale analysis of nuclear translocation in living cells was achieved by our novel method. The responses of the cells to IFNγ exhibited a significant drift across the population, but common features of the responses led us to propose a three-stage model of STAT1 import. The simplicity and automation of this method should enable its application in a broad spectrum of time-lapse studies of nuclear-cytoplasmic translocation.


Conflict of interest statement

Competing Interests: The authors have declared that no competing interests exist.

Figures

Figure 1
Figure 1. Flowchart for the time-lapse imaging system.
(A) Design of the experiment. (B) Diagram of the automated image analysis. Immediately after time-lapse imaging, cells were fixed and stained with Hoechst (step 1). With Ifixed_YFP as the reference, Ii_YFP was registered and generated Ii_YFP(r). Ii−1_YFP(r) was then generated after registration with Ii_YFP(r), and finally, I1_YFP(r) was generated (Step 2). Ifixed_hoechst was segmented to produce nuclear masks (Step 3), which were applied to process the registered time-lapse images (Step 4). i = n, n−1,…, 3, 2, represents images collected at i×10 min; (r) represents a registered image.
Figure 2
Figure 2. STAT1-YFP fluorescence before and after fixation.
STAT1-YFP was transiently expressed in Hela cells. YFP images of the untreated cells were collected, the cells were then fixed and YFP images of the same field were taken. Here shows representatives of a registered live-cell image and the fixed-cell image. For each image, a magnified view of the field is shown in an inset. Arrows point to areas with obvious change in fluorescence intensity. Images with black borders are the registered images; the borders indicate the distance by which the original YFP image is shifted away from the fixed-cell images. Scale bar, 20 µm.
Figure 3
Figure 3. Mismatch of nuclear masks with the nuclei increased the s.d. of the measured fluorescence of the target protein.
The experiment of time-lapse imaging of STAT1-YFP nuclear translocation was repeated three times independently with a cell-movement control (Materials and method) each time. The identified STAT1-YFP expressing cells from the cell-movement controls were pooled together. 300 matched nuclear masks, randomly selected from this pool, were shifted randomly out of their original positions along the horizontal, and (or) vertical, and (or) rotational directions to generate mismatched masks. The intersections between the mismatched and the original masks were used to mimic masks smaller than the real nuclei (not shown). (A) A simplified illustration of mismatched masks generated by artificially shifting a registered live-cell image of YFP emission. The original masks, shown as white outlines in the middle panel, were artificially shifted 8 pixels in left-to-right direction, generating mismatched masks (right panel). (B) For the generated mismatched masks (MM) and intersected masks (IM), the coefficients of variance (CV) (ratio of s.d. to mean) and mean of YFP fluorescence intensity were plotted against the area of the IM (represented by area ratio of the IM to the original mask), separately. Fluorescence intensity, FI. The CV and mean before the artificial variation was normalized to 1. The CV is represented by dashed lines and the scale on the right axis. The mean is represented by solid lines and the scale on the left axis. Scale bar, 20 µm. This experiment was repeated three times independently, and similar results were obtained. Here shows a representative experiment.
Figure 4
Figure 4. Identification of non-motile cells by classification of the nuclear masks.
(A) The s.d. was plotted against the mean for each of the measured YFP fluorescence in the cell-movement control, and the first images of the IFNγ treatment group. The data pairs from the cell-movement control were fitted to a solid line: y = 0.07821×x -16.83 with y s.d. and x mean. The dotted line represents the 99.5% confidence interval (CI) of the fit. The figure shows a typical result from three independent experiments, from 310 and 324 nuclei in the cell-movement control and treatment groups, respectively. (B) Examples of good segmentation (upper panel) and bad segmentation (lower panel) from typical images from the cell-movement control. (C) Representative segmentation effects in the time-lapse images at t = 0, or at 60 and 120 min after IFNγ treatment. The masks which generated data pairs from processing of the first image (0 min) that are within the CI are outlined in green, ones outside the CI are in red. For each image, magnified views of selected cells are shown in insets. Stars denote false masks. Arrows indicate identified mismatched masks at time 0. Images with black borders are registered images; the borders indicate the distance by which the original YFP images are shifted away from the fixed-cell images. Scale bar, 20 µm.
Figure 5
Figure 5. Comparison between NA and N∶C ratio for measuring STAT1 nuclear translocation.
To evaluate the utility of these two parameters in describing STAT1-YFP nuclear import in time-lapse images of IFNγ treated Hela cells, two sets of masks, cytoplasmic and nuclear, were produced by regulating the erosion and dilation (Image analysis). Here shows a typical STAT1-YFP image obtained at 120 min after IFNγ administration and its masks. One set of the mask was labeled in yellow, the other in both yellow and green (A, B). With the two sets of the masks, NA was employed to quantify STAT1 nuclear translocation, generating two data sets. The distribution of the difference variation between the two data sets is shown as a histogram (C). Likewise, the distribution of the difference variation of N∶C ratio was calculated (D). Results are from 32 sets of time-lapse images with 430 cells from a representative experiment. Images with black borders are the registered images; the borders indicate the distance by which the original YFP image is shifted away from the fixed-cell images. Scale bar: 20 µm.
Figure 6
Figure 6. Time course of STAT1-YFP import into nuclei.
Hela cells transiently expressing STAT1-YFP were treated with IFNγ for 120 min. Before treatment, STAT1-YFP fluorescence was mainly detected in the cytoplasm, the distribution of the N∶C ratios is shown as a histogram (A), the distribution shifted to B after the treatment. (C) For each cell that was responded to IFNγ (see “Patterns of STAT1-YFP nuclear import” for detail), the nuclear accumulation (NA) was quantified at the indicated time in the time course. Blue represents cell nuclei that were well segmented (match), and green represents cell nuclei that were motile or falsely segmented (mismatch or false). (D) Shows descriptive statistics (mean and standard deviation) of the data from C. Red represents all cells identified (total), including cells that were well segmented, falsely segmented and motile cells. Blue represents stationary cells in the time course (match). (E) The time course of STAT1-YFP nuclear import (as indicated by C, blue lines) was measured by nuclear increment (NI). The curves in red represent the median values in the time intervals showing the tendency. (F) Time required for STAT1-YFP to achieve maximum speed of translocation, and each bar represents the time point at which NI reached the maximum speed in the indicated number of cells. NI is more sensitive to noise than NA, so a 20-minute interval was used. Shown is a typical result from three independent experiments with 360 cells.
Figure 7
Figure 7. Correlation between cell heterogeneity to IFNγ and initial STAT1-YFP expression level.
Time-lapse images of Hela cells expressing STAT1-YFP were captured before and after 2 hours of IFNγ administration. (A) Nuclear∶cytoplasmic ratio (N∶C ratio) of STAT1-YFP fluorescence at 2 hours after the treatment was plotted against the cytoplasmic fluorescence intensity of the same cells before the treatment. (B) Relationship between the times required for STAT1-YFP to reach maximum nuclear translocation speed and the fluorescence intensity before stimulation. (C) STAT1-YFP fluorescence level in responsive and unresponsive cells. Cytoplasmic fluorescence intensity, CFI. Shown here is a typical result with 394 cells from three independent experiments.

Similar articles

Cited by

References

    1. Terry LJ, Wente SR. Flexible gates: dynamic topologies and functions for FG nucleoporins in nucleocytoplasmic transport. Eukaryot Cell. 2009;8:1814–1827. - PMC - PubMed
    1. Mullassery D, Horton CA, Wood CD, White MR. Single live-cell imaging for systems biology. Essays Biochem. 2008;45:121–133. - PMC - PubMed
    1. Carpenter AE, Jones TR, Lamprecht MR, Clarke C, Kang IH, et al. CellProfiler: image analysis software for identifying and quantifying cell phenotypes. Genome Biol. 2006;7:R100. - PMC - PubMed
    1. Starkuviene V, Pepperkok R. The potential of high-content high-throughput microscopy in drug discovery. Br J Pharmacol. 2007;152:62–71. - PMC - PubMed
    1. Darzynkiewicz Z, Smolewski P, Holden E, Luther E, Henriksen M, et al. Laser scanning cytometry for automation of the micronucleus assay. Mutagenesis. 2011;26:153–161. - PMC - PubMed

Publication types

MeSH terms