

Anticoagulants and the propagation phase of thrombin generation
- PMID: 22125631
- PMCID: PMC3220702
- DOI: 10.1371/journal.pone.0027852
Anticoagulants and the propagation phase of thrombin generation
Abstract
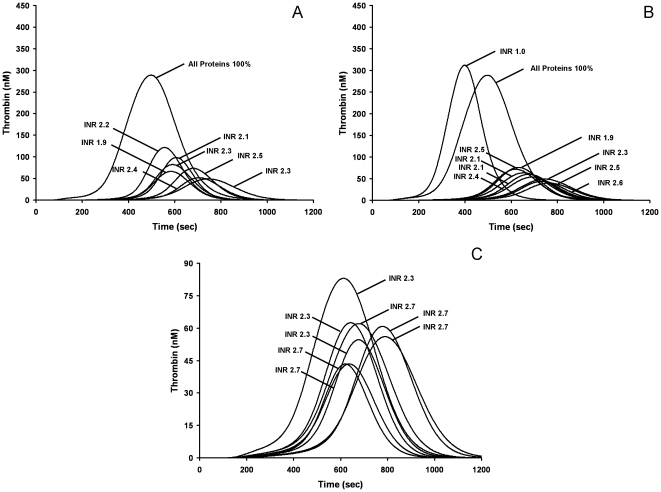
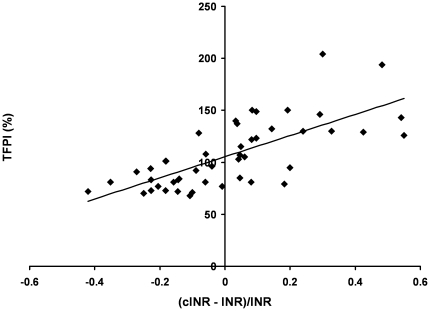
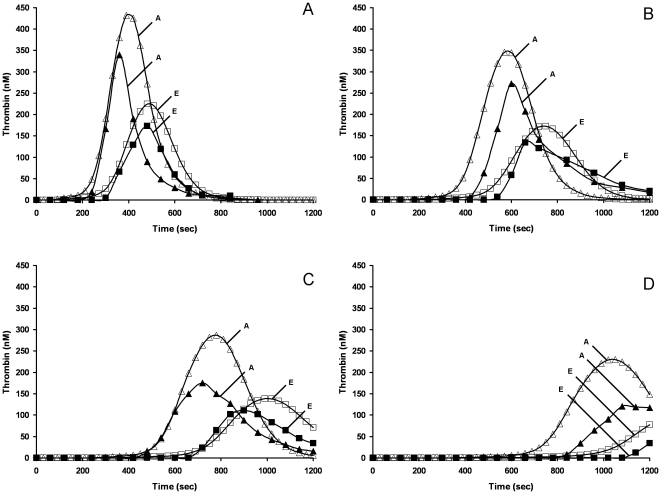
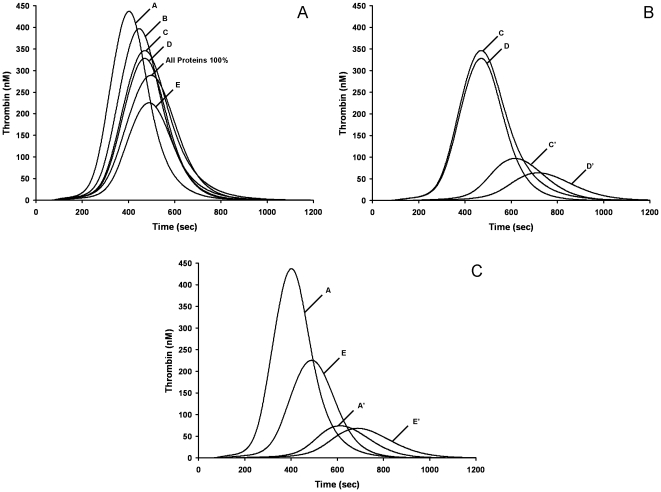
The view that clot time-based assays do not provide a sufficient assessment of an individual's hemostatic competence, especially in the context of anticoagulant therapy, has provoked a search for new metrics, with significant focus directed at techniques that define the propagation phase of thrombin generation. Here we use our deterministic mathematical model of tissue-factor initiated thrombin generation in combination with reconstructions using purified protein components to characterize how the interplay between anticoagulant mechanisms and variable composition of the coagulation proteome result in differential regulation of the propagation phase of thrombin generation. Thrombin parameters were extracted from computationally derived thrombin generation profiles generated using coagulation proteome factor data from warfarin-treated individuals (N = 54) and matching groups of control individuals (N = 37). A computational clot time prolongation value (cINR) was devised that correlated with their actual International Normalized Ratio (INR) values, with differences between individual INR and cINR values shown to derive from the insensitivity of the INR to tissue factor pathway inhibitor (TFPI). The analysis suggests that normal range variation in TFPI levels could be an important contributor to the failure of the INR to adequately reflect the anticoagulated state in some individuals. Warfarin-induced changes in thrombin propagation phase parameters were then compared to those induced by unfractionated heparin, fondaparinux, rivaroxaban, and a reversible thrombin inhibitor. Anticoagulants were assessed at concentrations yielding equivalent cINR values, with each anticoagulant evaluated using 32 unique coagulation proteome compositions. The analyses showed that no anticoagulant recapitulated all features of warfarin propagation phase dynamics; differences in propagation phase effects suggest that anticoagulants that selectively target fXa or thrombin may provoke fewer bleeding episodes. More generally, the study shows that computational modeling of the response of core elements of the coagulation proteome to a physiologically relevant tissue factor stimulus may improve the monitoring of a broad range of anticoagulants.
Conflict of interest statement
Figures
Similar articles
-
Contributions of procoagulants and anticoagulants to the international normalized ratio and thrombin generation assay in patients treated with warfarin: potential role of protein Z as a powerful determinant of coagulation assays.Thromb Res. 2013 Jul;132(1):e70-5. doi: 10.1016/j.thromres.2013.05.015. Epub 2013 Jun 13. Thromb Res. 2013. PMID: 23769659
-
Warfarin monitoring with viscoelastic haemostatic assays, thrombin generation, coagulation factors and correlations to Owren and Quick prothrombin time.Scand J Clin Lab Invest. 2018 Sep;78(5):358-364. doi: 10.1080/00365513.2018.1474492. Epub 2018 May 23. Scand J Clin Lab Invest. 2018. PMID: 29792060
-
During warfarin induction, the Fiix-prothrombin time reflects the anticoagulation level better than the standard prothrombin time.J Thromb Haemost. 2017 Jan;15(1):131-139. doi: 10.1111/jth.13549. Epub 2016 Nov 30. J Thromb Haemost. 2017. PMID: 27774726 Clinical Trial.
-
Developing individualized coagulation profiling of disease risk: thrombin generation dynamic models of the pro and anticoagulant balance.Thromb Res. 2014 May;133 Suppl 1:S9-S11. doi: 10.1016/j.thromres.2014.03.004. Thromb Res. 2014. PMID: 24759148 Review.
-
The challenge of regulating anticoagulant drugs: focus on warfarin.Am Heart J. 2005 Jan;149(1 Suppl):S36-42. doi: 10.1016/j.ahj.2004.10.021. Am Heart J. 2005. PMID: 15644792 Review. No abstract available.
Cited by
-
Defining the boundaries of normal thrombin generation: investigations into hemostasis.PLoS One. 2012;7(2):e30385. doi: 10.1371/journal.pone.0030385. Epub 2012 Feb 2. PLoS One. 2012. PMID: 22319567 Free PMC article.
-
Continuous thrombin generation in whole blood: New applications for assessing activators and inhibitors of coagulation.Anal Biochem. 2018 Jun 15;551:19-25. doi: 10.1016/j.ab.2018.05.005. Epub 2018 May 7. Anal Biochem. 2018. PMID: 29746819 Free PMC article.
-
The prothrombotic phenotypes in familial protein C deficiency are differentiated by computational modeling of thrombin generation.PLoS One. 2012;7(9):e44378. doi: 10.1371/journal.pone.0044378. Epub 2012 Sep 12. PLoS One. 2012. PMID: 22984498 Free PMC article.
-
Follow-up of thrombin generation after prostate cancer surgery: global test for increased hypercoagulability.PLoS One. 2012;7(12):e51299. doi: 10.1371/journal.pone.0051299. Epub 2012 Dec 7. PLoS One. 2012. PMID: 23236465 Free PMC article.
-
Is there value in kinetic modeling of thrombin generation? Yes.J Thromb Haemost. 2012 Aug;10(8):1463-9. doi: 10.1111/j.1538-7836.2012.04799.x. J Thromb Haemost. 2012. PMID: 22642417 Free PMC article. No abstract available.
References
-
- Ansell J, Hirsh J, Poller L, Bussey H, Jacobson A, et al. The pharmacology and management of the vitamin K antagonists: the Seventh ACCP Conference on Antithrombotic and Thrombolytic Therapy. Chest. 2004;126:204S–233S. - PubMed
-
- Eriksson BI, Quinlan DJ, Weitz JI. Comparative pharmacodynamics and pharmacokinetics of oral direct thrombin and factor xa inhibitors in development. Clin Pharmacokinet. 2009;48:1–22. - PubMed
-
- Samama MM, Martinoli JL, Leflem L, Guinet C, Plu-Bureau G, et al. Assessment of laboratory assays to measure rivaroxaban--an oral, direct factor Xa inhibitor. Thromb Haemost. 2010;103:815–825. - PubMed
-
- Hemker HC, Wielders S, Kessels H, Beguin S. Continuous registration of thrombin generation in plasma, its use for the determination of the thrombin potential. Thromb Haemost. 1993;70:617–624. - PubMed
-
- Rand MD, Lock JB, van 't Veer C, Gaffney DP, Mann KG. Blood clotting in minimally altered whole blood. Blood. 1996;88:3432–3445. - PubMed
Publication types
MeSH terms
Substances
Grants and funding
LinkOut - more resources
Full Text Sources
Other Literature Sources
Medical
Miscellaneous
