

Resting-state EEG source localization and functional connectivity in schizophrenia-like psychosis of epilepsy
- PMID: 22125634
- PMCID: PMC3220705
- DOI: 10.1371/journal.pone.0027863
Resting-state EEG source localization and functional connectivity in schizophrenia-like psychosis of epilepsy
Abstract
Background: It is unclear whether, like in schizophrenia, psychosis-related disruption in connectivity between certain regions, as an index of intrinsic functional disintegration, occurs in schizophrenia-like psychosis of epilepsy (SLPE). In this study, we sought to determine abnormal patterns of resting-state EEG oscillations and functional connectivity in patients with SLPE, compared with nonpsychotic epilepsy patients, and to assess correlations with psychopathological deficits.
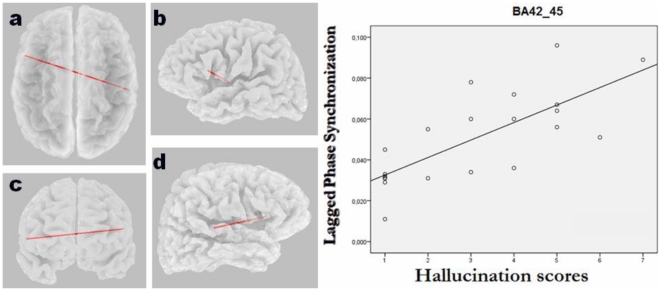
Methodology/principal findings: Resting EEG was recorded in 21 patients with focal epilepsy and SLPE and in 21 clinically-matched non-psychotic epilepsy controls. Source current density and functional connectivity were determined using eLORETA software. For connectivity analysis, a novel nonlinear connectivity measure called "lagged phase synchronization" was used. We found increased theta oscillations in regions involved in the default mode network (DMN), namely the medial and lateral parietal cortex bilaterally in the psychotic patients relative to their nonpsychotic counterparts. In addition, patients with psychosis had increased beta temporo-prefrontal connectivity in the hemisphere with predominant seizure focus. This functional connectivity in temporo-prefrontal circuits correlated with positive symptoms. Additionally, there was increased interhemispheric phase synchronization between the auditory cortex of the affected temporal lobe and the Broca's area correlating with auditory hallucination scores.
Conclusions/significance: In addition to dysfunction of parietal regions that are part of the DMN, resting-state disrupted connectivity of the medial temporal cortex with prefrontal areas that are either involved in the DMN or implicated in psychopathological dysfunction may be critical to schizophrenia-like psychosis, especially in individuals with temporal lobe epilepsy. This suggests that DMN deficits might be a core neurobiological feature of the disorder, and that abnormalities in theta oscillations and beta phase synchronization represent the underlying neural activity.
Conflict of interest statement
Figures


Similar articles
-
Resting-state network disruption and APOE genotype in Alzheimer's disease: a lagged functional connectivity study.PLoS One. 2012;7(9):e46289. doi: 10.1371/journal.pone.0046289. Epub 2012 Sep 25. PLoS One. 2012. PMID: 23050006 Free PMC article.
-
Simultaneous resting-state functional MRI and electroencephalography recordings of functional connectivity in patients with schizophrenia.Psychiatry Clin Neurosci. 2017 Apr;71(4):262-270. doi: 10.1111/pcn.12495. Epub 2017 Feb 21. Psychiatry Clin Neurosci. 2017. PMID: 27987251
-
Association of cerebral deficits with clinical symptoms in antipsychotic-naive first-episode schizophrenia: an optimized voxel-based morphometry and resting state functional connectivity study.Am J Psychiatry. 2009 Feb;166(2):196-205. doi: 10.1176/appi.ajp.2008.08020183. Epub 2008 Nov 3. Am J Psychiatry. 2009. PMID: 18981063
-
A working model of neural activity and phenomenal experience in psychosis.Mol Psychiatry. 2024 Dec;29(12):3814-3825. doi: 10.1038/s41380-024-02607-4. Epub 2024 Jun 6. Mol Psychiatry. 2024. PMID: 38844531 Review.
-
Does the salience network play a cardinal role in psychosis? An emerging hypothesis of insular dysfunction.J Psychiatry Neurosci. 2012 Jan;37(1):17-27. doi: 10.1503/jpn.100176. J Psychiatry Neurosci. 2012. PMID: 21693094 Free PMC article. Review.
Cited by
-
Violence in video game produces a lower activation of limbic and temporal areas in response to social inclusion images.Cogn Affect Behav Neurosci. 2019 Aug;19(4):898-909. doi: 10.3758/s13415-018-00683-y. Cogn Affect Behav Neurosci. 2019. PMID: 30565058
-
Neuronal oscillations and synchronicity associated with gamma-hydroxybutyrate during resting-state in healthy male volunteers.Psychopharmacology (Berl). 2017 Jul;234(13):1957-1968. doi: 10.1007/s00213-017-4603-z. Epub 2017 Apr 20. Psychopharmacology (Berl). 2017. PMID: 28429067
-
Childhood trauma is associated with developmental trajectories of EEG coherence, alcohol-related outcomes, and PTSD symptoms.Psychol Med. 2024 Dec 2;54(15):1-14. doi: 10.1017/S0033291724002599. Online ahead of print. Psychol Med. 2024. PMID: 39620481 Free PMC article.
-
Resting state networks in temporal lobe epilepsy.Epilepsia. 2013 Dec;54(12):2048-59. doi: 10.1111/epi.12400. Epub 2013 Oct 10. Epilepsia. 2013. PMID: 24117098 Free PMC article. Review.
-
Frequency dependent alterations in regional homogeneity of baseline brain activity in schizophrenia.PLoS One. 2013;8(3):e57516. doi: 10.1371/journal.pone.0057516. Epub 2013 Mar 6. PLoS One. 2013. PMID: 23483911 Free PMC article.
References
-
- Johnson MR, Morris NA, Astur RS, Calhoun VD, Mathalon DH, et al. A functional magnetic resonance imaging study of working memory abnormalities in schizophrenia. Biol Psychiatry. 2006;60:11–21. - PubMed
-
- Pettersson-Yeo W, Allen P, Benetti S, McGuire P, Mechelli A. Dysconnectivity in schizophrenia: Where are we now? Neurosci Biobehav Rev. 2011;35:1110–1124. - PubMed
