

Effects of coral reef benthic primary producers on dissolved organic carbon and microbial activity
- PMID: 22125645
- PMCID: PMC3220721
- DOI: 10.1371/journal.pone.0027973
Effects of coral reef benthic primary producers on dissolved organic carbon and microbial activity
Abstract
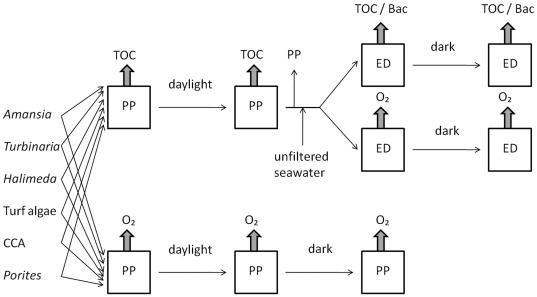
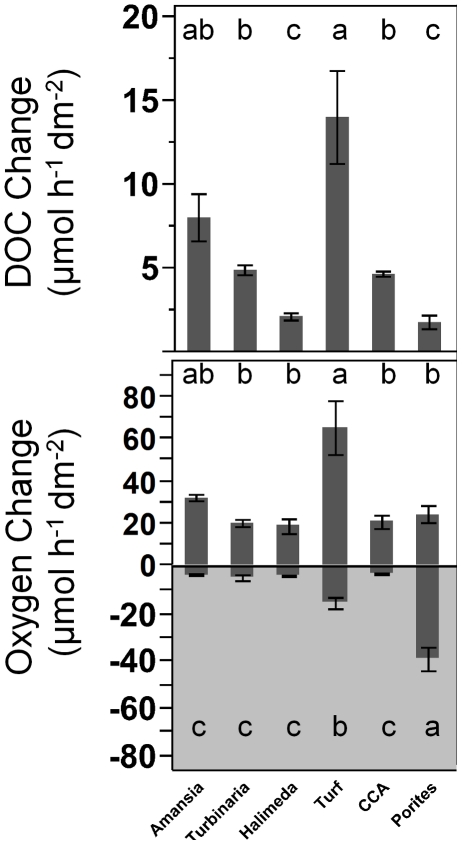
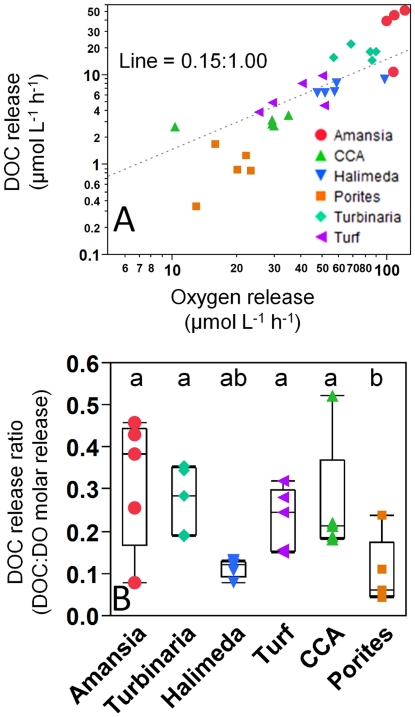
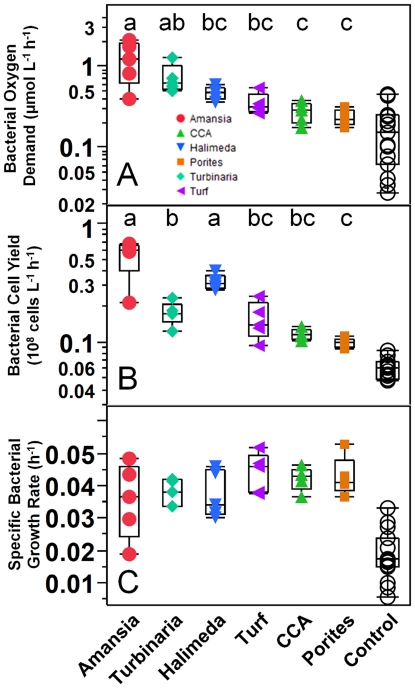
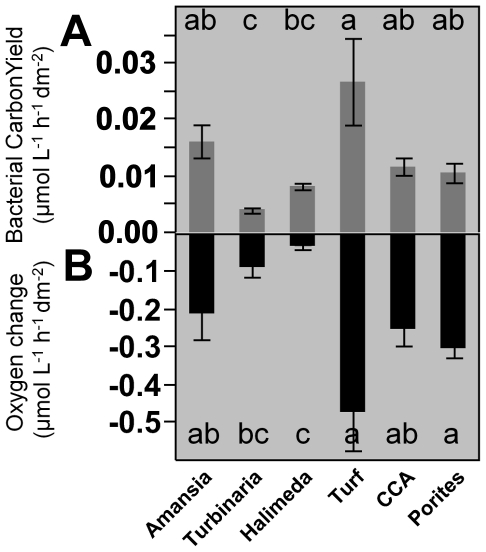
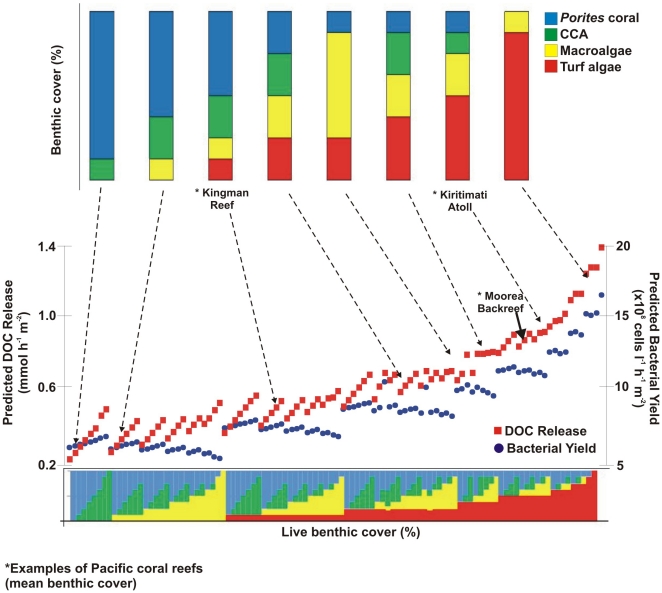
Benthic primary producers in marine ecosystems may significantly alter biogeochemical cycling and microbial processes in their surrounding environment. To examine these interactions, we studied dissolved organic matter release by dominant benthic taxa and subsequent microbial remineralization in the lagoonal reefs of Moorea, French Polynesia. Rates of photosynthesis, respiration, and dissolved organic carbon (DOC) release were assessed for several common benthic reef organisms from the backreef habitat. We assessed microbial community response to dissolved exudates of each benthic producer by measuring bacterioplankton growth, respiration, and DOC drawdown in two-day dark dilution culture incubations. Experiments were conducted for six benthic producers: three species of macroalgae (each representing a different algal phylum: Turbinaria ornata--Ochrophyta; Amansia rhodantha--Rhodophyta; Halimeda opuntia--Chlorophyta), a mixed assemblage of turf algae, a species of crustose coralline algae (Hydrolithon reinboldii) and a dominant hermatypic coral (Porites lobata). Our results show that all five types of algae, but not the coral, exuded significant amounts of labile DOC into their surrounding environment. In general, primary producers with the highest rates of photosynthesis released the most DOC and yielded the greatest bacterioplankton growth; turf algae produced nearly twice as much DOC per unit surface area than the other benthic producers (14.0±2.8 µmol h⁻¹ dm⁻²), stimulating rapid bacterioplankton growth (0.044±0.002 log10 cells h⁻¹) and concomitant oxygen drawdown (0.16±0.05 µmol L⁻¹ h⁻¹ dm⁻²). Our results demonstrate that benthic reef algae can release a significant fraction of their photosynthetically-fixed carbon as DOC, these release rates vary by species, and this DOC is available to and consumed by reef associated microbes. These data provide compelling evidence that benthic primary producers differentially influence reef microbial dynamics and biogeochemical parameters (i.e., DOC and oxygen availability, bacterial abundance and metabolism) in coral reef communities.
Conflict of interest statement
Figures
References
-
- Adams AJ, Dahlgren CP, Kellison GT, Kendall MS, Laymans CA, et al. Nursery function of tropical back-reef systems. Mar Ecol Prog Ser. 2006;318:287–301.
-
- Biber PD, Harwell MA, Cropper WP., Jr Modelling the dynamics of three functional groups of macroalgae in tropical seagrass habitats. Ecolmodel. 2004;175:25–54.
-
- Fonseca MS, Kenworthy WJ, Whitfield PE. Temporal dynamics of seagrass landscapes: a preliminary comparison of chronic and extreme disturbance events. Biol Mar Mediterr. 2000;7:373–376.
-
- Kendrick GA, Hegge BJ, Wyllie A, Davidson A, Lord DA. Changes in seagrass cover on Success and Parmelia Banks, Western Australia between 1965 and 1995. Estuar Coast Shelf S. 2000;50:341–353.
-
- Eyre BD, Ferguson AJP. Comparison of carbon production and decomposition, benthic nutrient fluxes and denitrification in seagrass, phytoplankton, benthic microalgae- and macroalgae- dominated warm-temperate Australian lagoons. Mar Ecol Prog Ser. 2002;229:43–59.
Publication types
MeSH terms
Substances
LinkOut - more resources
Full Text Sources
