. 2011 Nov 29;4(201):rs13.
doi: 10.1126/scisignal.2002189.

SH3 domain-based phototrapping in living cells reveals Rho family GAP signaling complexes

Affiliations

SH3 domain-based phototrapping in living cells reveals Rho family GAP signaling complexes

Hirokazu Okada et al. Sci Signal. .

Abstract

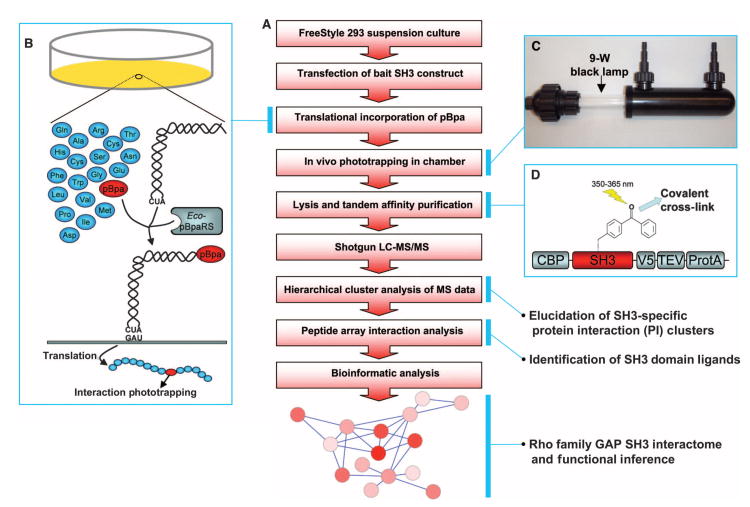
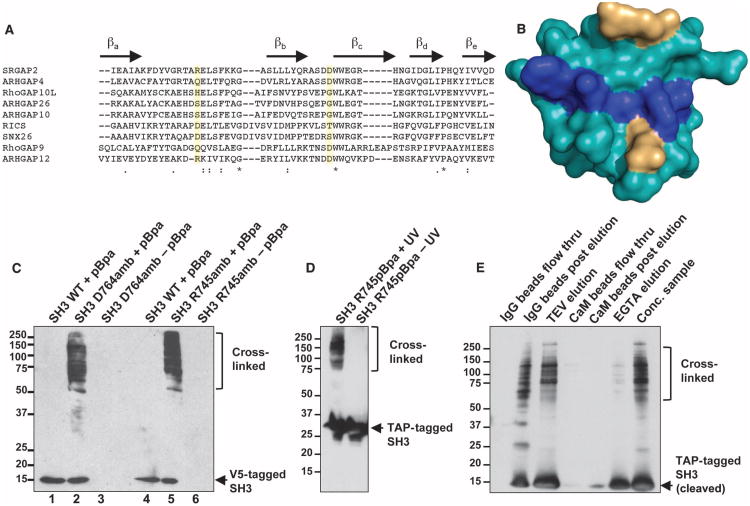
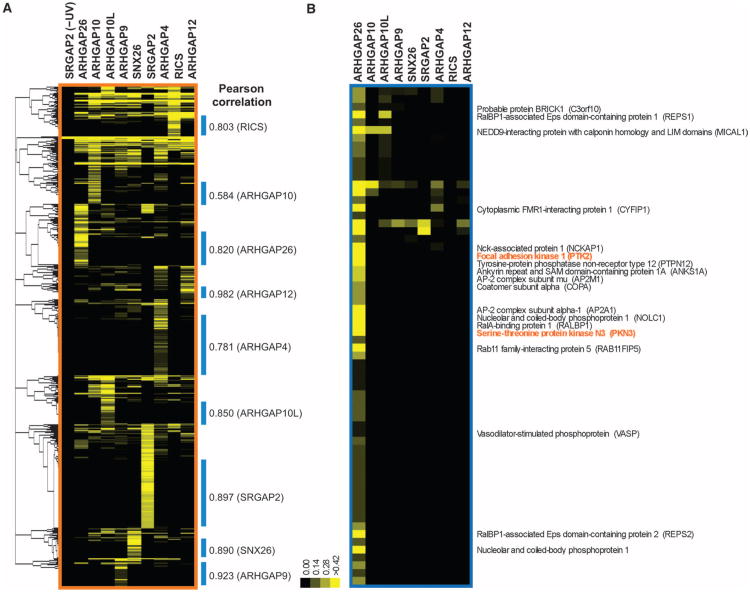
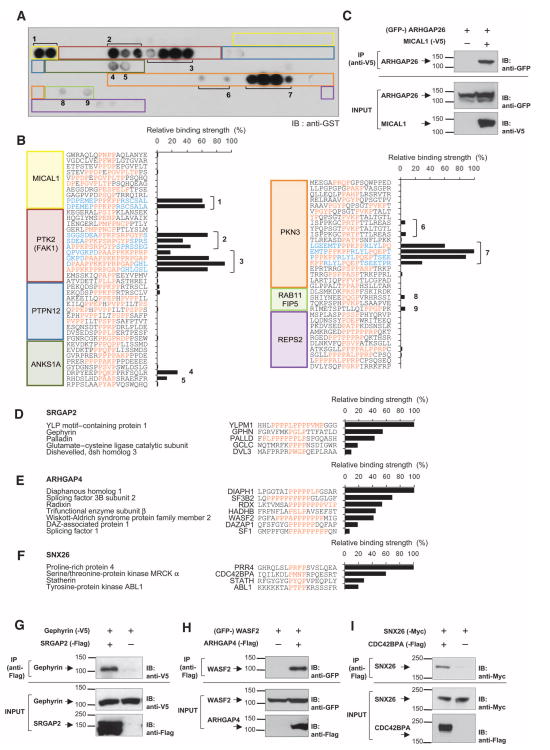
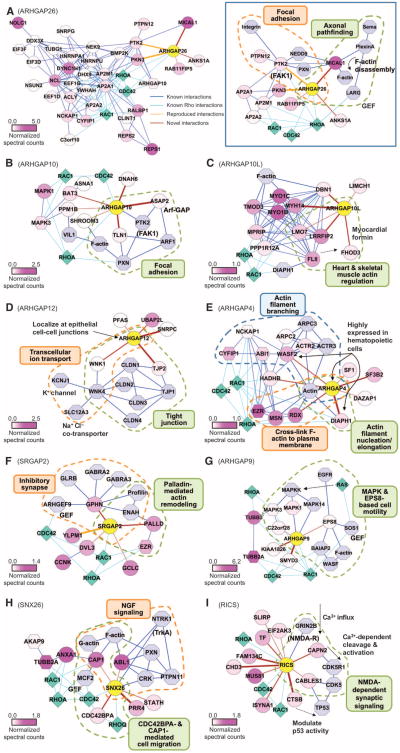
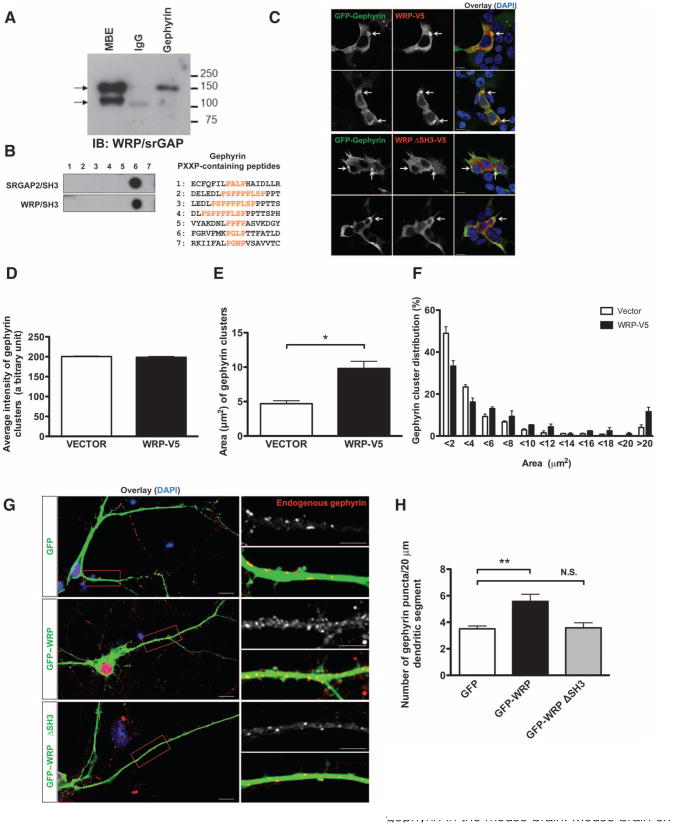
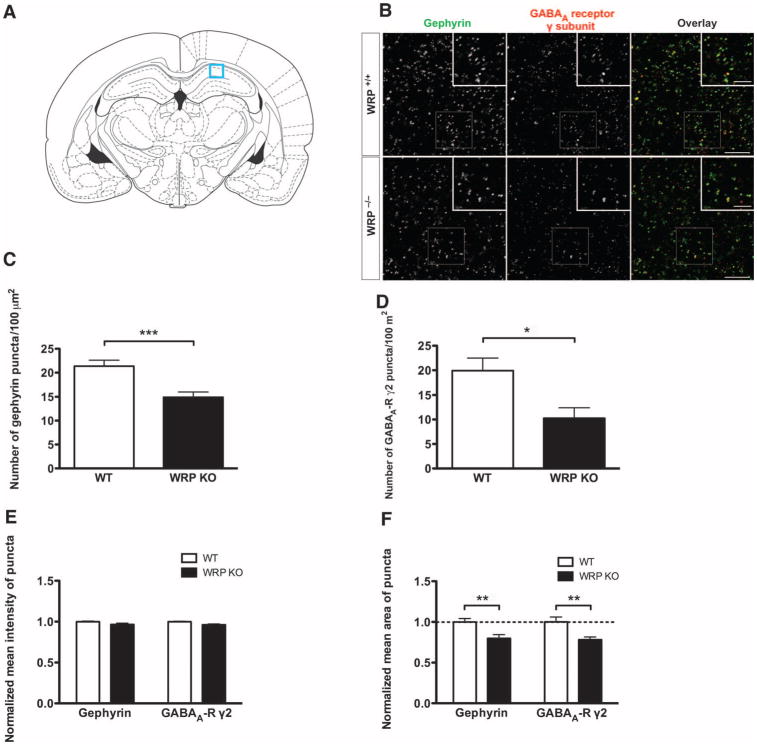
Rho family GAPs [guanosine triphosphatase (GTPase) activating proteins] negatively regulate Rho family GTPase activity and therefore modulate signaling events that control cytoskeletal dynamics. The spatial distribution of these GAPs and their specificity toward individual GTPases are controlled by their interactions with various proteins within signaling complexes. These interactions are likely mediated through the Src homology 3 (SH3) domain, which is abundant in the Rho family GAP proteome and exhibits a micromolar binding affinity, enabling the Rho family GAPs to participate in transient interactions with multiple binding partners. To capture these elusive GAP signaling complexes in situ, we developed a domain-based proteomics approach, starting with in vivo phototrapping of SH3 domain-binding proteins and the mass spectrometry identification of associated proteins for nine representative Rho family GAPs. After the selection of candidate binding proteins by cluster analysis, we performed peptide array-based high-throughput in vitro binding assays to confirm the direct interactions and map the SH3 domain-binding sequences. We thereby identified 54 SH3-mediated binding interactions (including 51 previously unidentified ones) for nine Rho family GAPs. We constructed Rho family GAP interactomes that provided insight into the functions of these GAPs. We further characterized one of the predicted functions for the Rac-specific GAP WRP and identified a role for WRP in mediating clustering of the postsynaptic scaffolding protein gephyrin and the GABA(A) (γ-aminobutyric acid type A) receptor at inhibitory synapses.


Figures

Fig. 1
Fig. 1
Experimental design to identify Rho family GAP protein complexes. (A) Workflow of overall approach to construct Rho family GAP interactomes. (B) Schematics for in vivo phototrapping strategy. A photo-activatable cross-linker, pBpa, is translationally incorporated into a cellular protein of interest at the site designated by an amber codon when coexpressed with a pBpa-specific tRNA synthetase and amber suppression tRNA. pBpa covalently cross-links with a binding protein when UV light is applied. (C) Modified cross-linking chamber for cells in suspension with inlet, outlet, and 9-W 350- to 365-nm light source. (D) Schematic of the SH3 domain expression construct. TAP tag (protein A, TEV protease cleavage site, and CBP) was attached to the SH3 domain for the effective isolation of SH3 domain–ligand cross-linked protein complexes. A V5 epitope was added to follow the TAP purification process.
Fig. 2
Fig. 2
In vivo phototrapping and purification of ligands for Rho family GAP SH3 domains. (A) Sequence alignment of the Rho family GAP SH3 domains used in this study. Two amino acid positions (in yellow) were used to place pBpa within the SH3 domains listed. β Sheets a to e of the SH3 domain structure are indicated above. (B) Positions of pBpa within the structure of a Rho family GAP SH3 domain. The SH3 domain structure of SRGAP1 was used to determine the candidate residues (in yellow) to be replaced with pBpa that correspond to the residues in yellow in (A). Ligand-binding pocket is shown in blue. (C) In situ photo–cross-linking of an SH3 domain. Cells expressing V5-tagged wild-type (WT) SRGAP2 SH3 domain (lanes 1 and 4) or amber mutations (D764amb: lanes 2 and 3; R745amb: lanes 5 and 6) were grown with (lanes 2 and 5) or without (lanes 3 and 6) pBpa and subjected to UV light. Western blot analysis of the immunoprecipitates by anti-V5 antibody reveals cross-linked high–molecular weight SH3-linked protein complexes. Representative blot from n = 2 is shown. (D) Photoactivation-dependent cross-linking of an SH3 domain. Cellsexpressing TAP-tagged SRGAP2 R745amb mutation SH3 domain were in-cubated with pBpa. After 3 days, cells were exposed to UV light in a photo–cross-linking chamber. Western blot analysis reveals photo-activatedcross-linking of the SH3 domain. Representative blot from n = 2 is shown. (E) TAP of cross-linked SH3 domain protein complexes. The cell lysate obtained in (D) was subjected to TAP. The final eluate was concentrated bycentrifugal filtration (Conc. sample) and subjected to mass spectrometricanalysis. Representative blot from n = 3 is shown.
Fig. 3
Fig. 3
Elucidation of protein clusters enriched with Rho family GAP SH3 domains after in vivo phototrapping. (A) Hierarchical clustering of MS-identified SH3 domain–associated proteins. Hierarchical clustering analysis was performed with unbiased Pearson correlation of the mean normalized spectral counts for the Rho family GAP SH3 domains listed in Fig. 2. Protein clusters designated with blue bars contain proteins that predominantly associated with individual SH3 domains. The degree of correlation in each cluster is shown. (B) Protein cluster with a predominant specificity for the ARHGAP26 SH3 domain. Proteins that have relatively high spectral counts or have been implicated in cytoskeletal regulation are exhibited. This protein cluster contains two proteins (PTK2 and PKN3 in orange) known to interact with ARHGAP26 in an SH3 domain–dependent manner.
Fig. 4
Fig. 4
Identification of SH3 domain ligands. (A) Array-based binding assay to identify SH3 domain–binding peptides. Peptides (18-mer) containing PXXP motifs from proteins in the ARHGAP26 PI cluster were synthesized, incubated with purified GST-tagged ARHGAP26 SH3 domain, and immunoblotted with anti-GST antibody. Colored rectangles and numbers indicate the positions of peptides that correspond to the peptide sequences listed in (B). Representative blot from n = 2 is shown. (B) SH3 ligand identification and determination of relative binding strength. Peptide immunoblots generated in (A) were densitometrically quantified. The apparent binding strength was normalized to the strongest interaction for ARHGAP26. PXXP motifs are indicated in orange. Numbers indicate unique motifs bound to the ARHGAP26 SH3 domain with more than 5% normalized binding strength. Note that peptides overlap each other (indicated in blue) and contain the identical core motif sequences. See fig. S2, A to I, for the in vitro binding assays for all Rho family GAP SH3 domains analyzed. (C) Coimmuno-precipitation (IP) of full-length ARHGAP26 by MICAL1. The cell lysates of HEK293 cells expressing GFP-tagged ARHGAP26 with or without V5-tagged MICAL1 were immunoprecipitated and blotted as indicated. Representative blot from n = 2 is shown. (D to F) SH3 domain ligands and their binding strengths for SRGAP2, ARHGAP4, and SNX26. PI clusters specific to SRGAP2, ARHGAP4, or SNX26 were subjected to peptide array–based in vitro binding assays as for ARHGAP26. Pep-tides that showed positive binding (more than 5% normalized binding strength) to each SH3 domain are shown. (G to I) Coimmunoprecipitation experiments using full-length Rho family GAPs. (G) HEK293 cells coexpressing gephyrin-V5 with vector or SRGAP2-Flag, (H) GFP-WASF2 with vector or ARHGAP4-Flag, or (I) SNX26-Myc with CDC42BPA-Flag or vector were subjected to immunoprecipitation and Western blot analysis by indicated antibodies. n = 2 to 4 for each coimmunoprecipitation. See fig. S2, J and K, for additional coimmunoprecipitation experiments.
Fig. 5
Fig. 5
Rho family GAP interactome graphs with inferred cellular functions. Protein-protein interaction networks constructed from the interactions identified in this study and previously identified (physical) interactions. Circle nodes represent proteins in the PI clusters specific to individual SH3 domains. Hexagon nodes represent proteins that were associated with two SH3 domains but were excluded from PI clusters in the hierarchical clustering. Both nodes are colored in the purple spectrum (bottom left of each graph) reflecting the mean normalized spectral counts. Light blue octagon nodes indicate proteins identified in previous studies. Diamond nodes in cyan represent GTPases. Brown edges represent interactions identified here, and orange edges indicate known interactions reproduced in this study. Edge thickness reflects the relative binding affinity determined by in vitro binding assays. Blue and cyan edges of constant thickness indicate previously known interactions. (A, left) ARHGAP26 interactome graph. Proteins from the ARHGAP26-specific PI cluster (circle nodes) and ARHGAP26-enriched proteins (hexagon nodes) make a densely connected protein network. (See fig. S3, A to I, for other Rho family GAP interactomes.) (A to I) Graphs of Rho family GAP interactomes based on direct interactions identified in this study combined with previously known interactions to infer cellular functions. Subnetworks with specific cell functions are grouped by dashed line and indicated (see text for details).
Fig. 6
Fig. 6
WRP enhances gephyrin clustering in HEK cells and hippocampal neurons. (A) Coimmunoprecipitation of SRGAP2 and WRP by gephyrin in the mouse brain. Mouse brain extract (MBE) was subjected to immunoprecipitation with anti-gephyrin antibody. Coprecipitation of SRGAP2 or WRP (indicated by arrows) was observed by Western blot using anti-SRGAP2/WRP antibody. Representative blot from n = 4 is shown. (B) SRGAP2 and WRP bind the same site in gephyrin. Gephyrin peptides (18-mer) containing PXXP motifs were synthesized, incubated with purified GST-tagged SH3 domains of SRGAP2 or WRP, and immunoblotted with anti-GST antibody. Representative blot from n = 2 is shown. (C) Colocalization of WRP with clustered gephyrin in HEK293 cells. GFP-tagged gephyrin was coexpressed in HEK293 cells with V5-tagged WRP or WRP lacking its SH3 domain. Immunofluorescence was visualized with anti-GFP (green) and anti-V5 antibodies (red), or 4′,6-diamidino-2-phenylindole (DAPI) (blue). Arrows indicate gephyrin clusters. Scale bars, 10 mm. (D to F) Increased size of gephyrin clusters upon WRP coexpression. Area of gephyrin clusters was measured in cells cotransfected with GFP-gephyrin and vector or WRP-V5. Average intensity (D), area (E), and area distribution (F) of gephyrin clusters from three independent experiments are shown. Data are presented as means ± SEM. *P < 0.0005 (two-tailed t test). (G) SH3-dependent increase in endogenous gephyrin clustering by WRP. Hippocampal neurons transfected at DIV9 with GFP, GFP-tagged WRP, or WRP lacking the SH3 domain were fixed at DIV12 and stained with anti-gephyrin antibody. Scale bars, 10 mm (left panels) or 5 mm (right panels). (H) Quantification of the gephyrin clusters in (G). GFP, n = 42 neurons from seven mice; GFP-WRP, n = 27 neurons from four mice; GFP-WRP DSH3, n = 14 neurons from three mice. Data are presented as means ± SEM. **P < 0.0005 (two-tailed t test). N.S., not significant.
Fig. 7
Fig. 7
WRP promotes postsynaptic clustering of gephyrin and GABAA receptors in vivo. (A) Coronal section of mouse brain. Immunohistological analysis was performed on the CA1 region of the hippocampal formation (boxed region) where inhibitory synapses are made on the dendrites of pyramidal neurons. (B) Reduction of gephyrin cluster density and associated GABAA receptors in WRP knockout (KO) mice. Stratum radiatum of CA1 region in the hippocampal formation from WRP+/+ or WRP-/- mice was stained with anti-gephyrin and anti-GABAA receptor γ subunit antibodies. (C and D) Quantification of the density of gephyrin and GABAA receptor puncta. n = 3 mice. From each mouse, four brain slices were processed for immunostaining and two images per slice were obtained. Data are presented as means ± SEM. ***P < 0.0005; *P < 0.01 (two-tailed t test). (E) Comparison of the average fluorescence intensity of gephyrin and GABAA receptor puncta. (F) Decreased sizes of gephyrin and GABAA receptor puncta in WRP knockout mice. Data are presented as means ± SEM. **P < 0.005 (two-tailed t test).

References

    1. Van Aelst L, D'Souza-Schorey C. Rho GTPases and signaling networks. Genes Dev. 1997;11:2295–2322. - PubMed
    1. Symons M, Settleman J. Rho family GTPases: More than simple switches. Trends Cell Biol. 2000;10:415–419. - PubMed
    1. Tcherkezian J, Lamarche-Vane N. Current knowledge of the large RhoGAP family of proteins. Biol Cell. 2007;99:67–86. - PubMed
    1. Bernards A, Settleman J. GAP control: Regulating the regulators of small GTPases. Trends Cell Biol. 2004;14:377–385. - PubMed
    1. Mayer BJ. SH3 domains: Complexity in moderation. J Cell Sci. 2001;114:1253–1263. - PubMed

Publication types

MeSH terms

Substances

LinkOut - more resources