

Computational image analysis of nuclear morphology associated with various nuclear-specific aging disorders
- PMID: 22127259
- PMCID: PMC3324345
- DOI: 10.4161/nucl.2.6.17798
Computational image analysis of nuclear morphology associated with various nuclear-specific aging disorders
Abstract
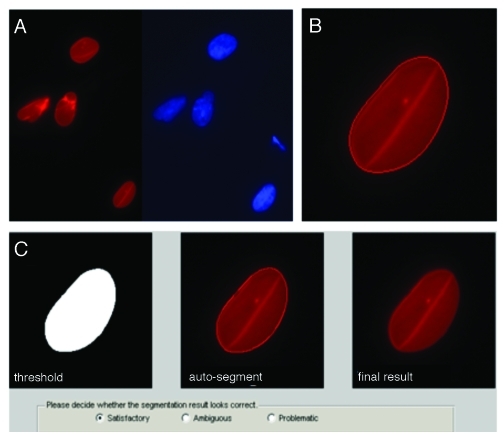
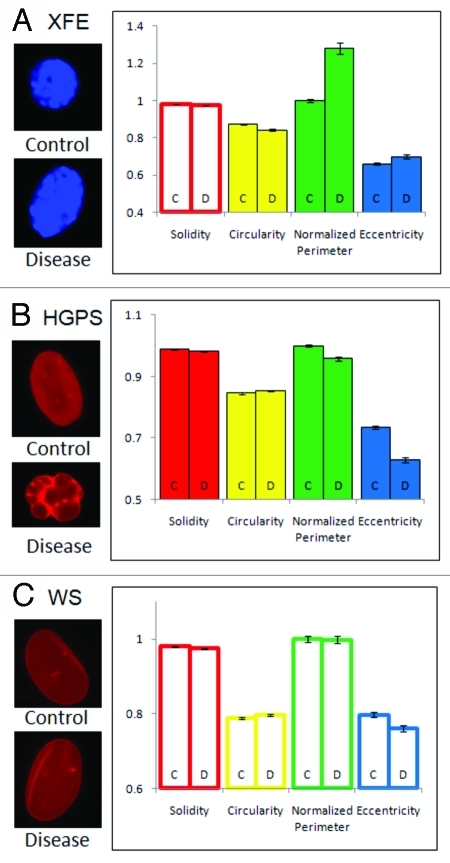
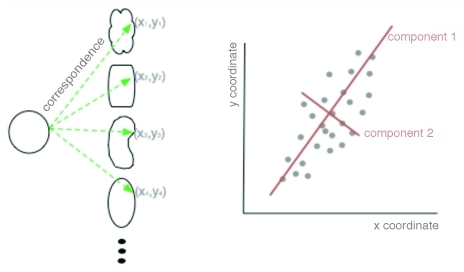
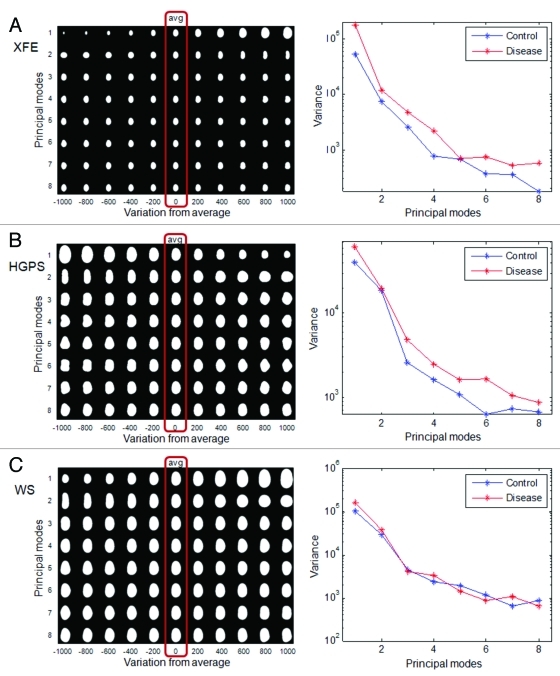
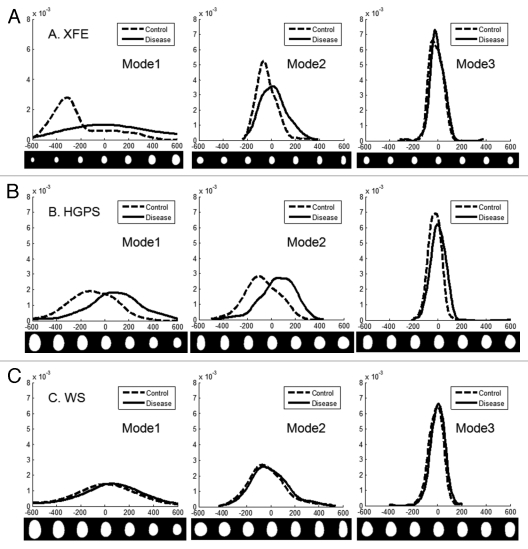
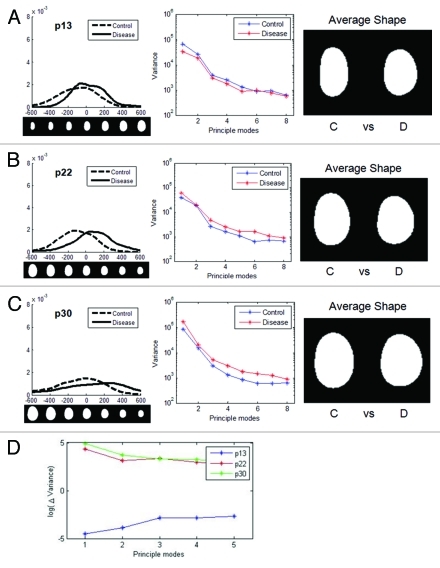
Computational image analysis is used in many areas of biological and medical research, but advanced techniques including machine learning remain underutilized. Here, we used automated segmentation and shape analyses, with pre-defined features and with computer generated components, to compare nuclei from various premature aging disorders caused by alterations in nuclear proteins. We considered cells from patients with Hutchinson-Gilford progeria syndrome (HGPS) with an altered nucleoskeletal protein; a mouse model of XFE progeroid syndrome caused by a deficiency of ERCC1-XPF DNA repair nuclease; and patients with Werner syndrome (WS) lacking a functional WRN exonuclease and helicase protein. Using feature space analysis, including circularity, eccentricity, and solidity, we found that XFE nuclei were larger and significantly more elongated than control nuclei. HGPS nuclei were smaller and rounder than the control nuclei with features suggesting small bumps. WS nuclei did not show any significant shape changes from control. We also performed principle component analysis (PCA) and a geometric, contour based metric. PCA allowed direct visualization of morphological changes in diseased nuclei, whereas standard, feature-based approaches required pre-defined parameters and indirect interpretation of multiple parameters. Both methods yielded similar results, but PCA proves to be a powerful pre-analysis methodology for unknown systems.
Figures
Similar articles
-
Model of human aging: recent findings on Werner's and Hutchinson-Gilford progeria syndromes.Clin Interv Aging. 2008;3(3):431-44. doi: 10.2147/cia.s1957. Clin Interv Aging. 2008. PMID: 18982914 Free PMC article. Review.
-
Prematurely aged children: molecular alterations leading to Hutchinson-Gilford progeria and Werner syndromes.Curr Aging Sci. 2008 Dec;1(3):202-12. doi: 10.2174/1874609810801030202. Curr Aging Sci. 2008. PMID: 20021393 Review.
-
Accelerated aging syndromes, are they relevant to normal human aging?Aging (Albany NY). 2011 Sep;3(9):889-95. doi: 10.18632/aging.100383. Aging (Albany NY). 2011. PMID: 21931180 Free PMC article.
-
Oxidative stress and antioxidant response in fibroblasts from Werner and atypical Werner syndromes.Aging (Albany NY). 2014 Mar;6(3):231-45. doi: 10.18632/aging.100649. Aging (Albany NY). 2014. PMID: 24799429 Free PMC article.
-
Search and insights into novel genetic alterations leading to classical and atypical Werner syndrome.Gerontology. 2014;60(3):239-46. doi: 10.1159/000356030. Epub 2014 Jan 3. Gerontology. 2014. PMID: 24401204 Free PMC article. Review.
Cited by
-
A comprehensive review of computational and image analysis techniques for quantitative evaluation of striated muscle tissue architecture.Biophys Rev (Melville). 2022 Dec;3(4):041302. doi: 10.1063/5.0057434. Epub 2022 Nov 4. Biophys Rev (Melville). 2022. PMID: 36407035 Free PMC article. Review.
-
Lamin microaggregates lead to altered mechanotransmission in progerin-expressing cells.Nucleus. 2020 Dec;11(1):194-204. doi: 10.1080/19491034.2020.1802906. Nucleus. 2020. PMID: 32816594 Free PMC article.
-
Targeted ablation of nesprin 1 and nesprin 2 from murine myocardium results in cardiomyopathy, altered nuclear morphology and inhibition of the biomechanical gene response.PLoS Genet. 2014 Feb 20;10(2):e1004114. doi: 10.1371/journal.pgen.1004114. eCollection 2014 Feb. PLoS Genet. 2014. PMID: 24586179 Free PMC article.
-
Aging and physiological barriers: mechanisms of barrier integrity changes and implications for age-related diseases.Mol Biol Rep. 2024 Aug 19;51(1):917. doi: 10.1007/s11033-024-09833-7. Mol Biol Rep. 2024. PMID: 39158744 Review.
-
Failure to repair endogenous DNA damage in β-cells causes adult-onset diabetes in mice.Aging Biol. 2023;1(1):20230015. doi: 10.59368/agingbio.20230015. Epub 2023 Oct 23. Aging Biol. 2023. PMID: 38124711 Free PMC article.
References
-
- Classes in oncology: George Nicholas Papanicolaou's new cancer diagnosis presented at the Third Race Betterment Conference, Battle Creek, Michigan, January 2-6, 1928, and published in the Proceedings of the Conference. CA Cancer J Clin. 1973;23:174–9. - PubMed
-
- Duncan JS, Ayache N. Medical image analysis: Progress over two decades and the challenges ahead. IEEE Trans Pattern Anal Mach Intell. 2000;22:85–106. doi: 10.1109/34.824822. - DOI
-
- Dawson AE, Austin RE, Jr., Weinberg DS. Nuclear grading of breast carcinoma by image analysis. Classification by multivariate and neural network analysis. Am J Clin Pathol. 1991;95:S29–37. - PubMed
Publication types
MeSH terms
Substances
Grants and funding
LinkOut - more resources
Full Text Sources