

Optimized amplification and single-cell analysis identify GnRH-mediated activation of Rap1b in primary rat gonadotropes
- PMID: 22127306
- PMCID: PMC3919063
- DOI: 10.1016/j.mce.2011.11.017
Optimized amplification and single-cell analysis identify GnRH-mediated activation of Rap1b in primary rat gonadotropes
Abstract
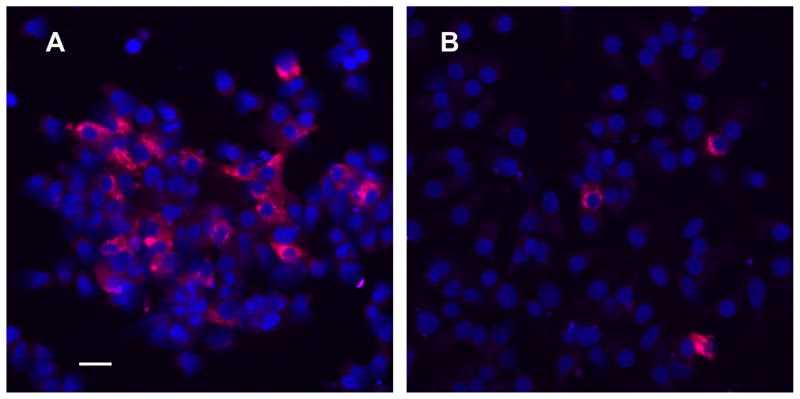
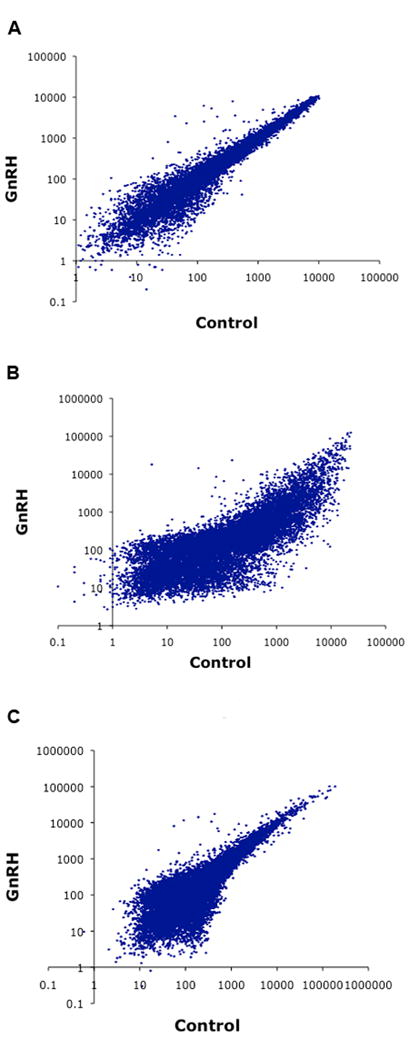
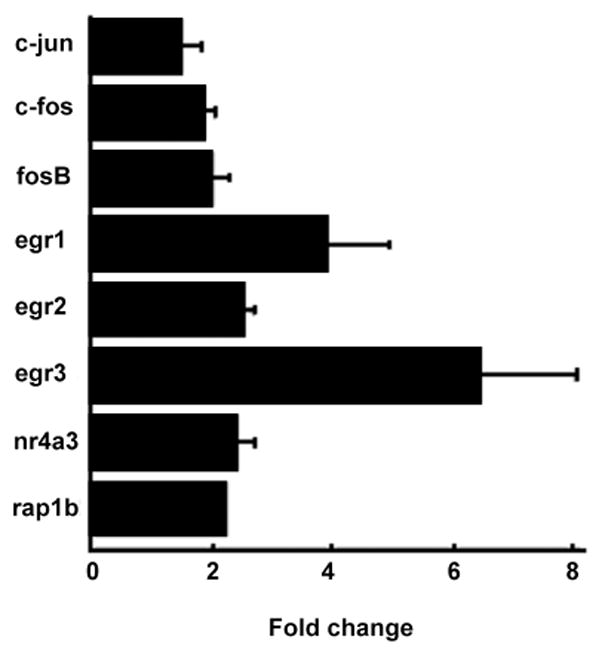
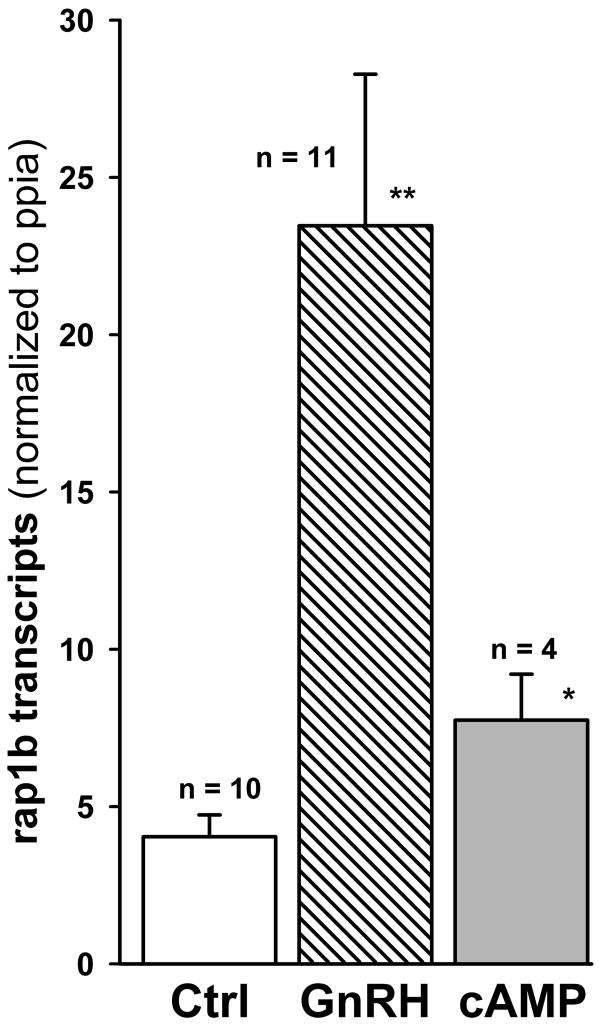
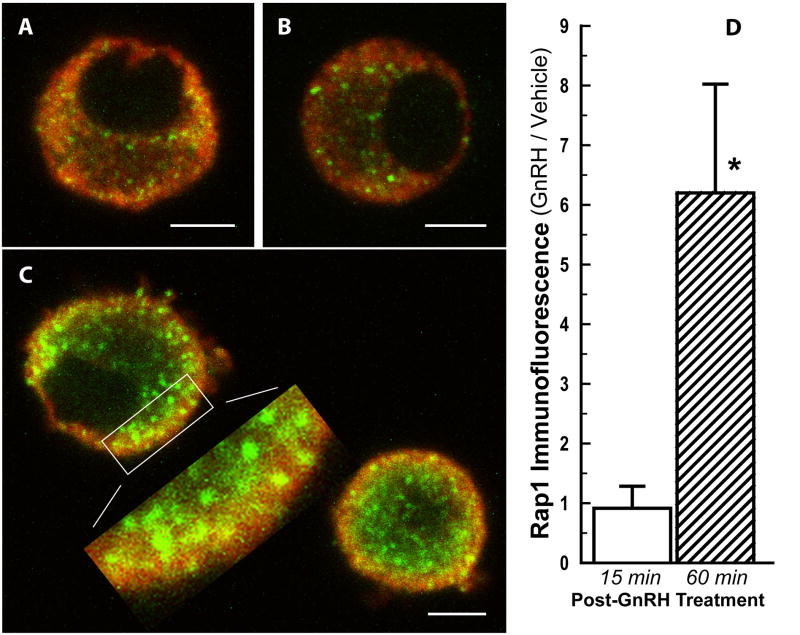
Identifying the early gene program induced by GnRH would help understand how GnRH-activated signaling pathways modulate gonadotrope secretory response. We previously analyzed GnRH-induced early genes in LβT2 cells, however these lack GnRH self-potentiation, a physiological attribute of gonadotropes. To minimize cellular heterogeneity, rat primary pituitary cultures were enriched for gonadotropes by 40-60% using a sedimentation gradient. Given the limited number of gonadotropes, RNA was amplified prior to microarray analysis. Thirty-three genes were up-regulated 40 min after GnRH stimulation. Real-time PCR confirmed regulation of several transcripts including fosB, c-fos, egr-2 and rap1b, a small GTPase and member of the Ras family. GnRH stimulated rap1b gene expression in gonadotropes, measured by a sensitive single cell assay. Immunocytochemistry revealed increased Rap1 protein in GnRH-stimulated gonadotropes. These data establish rap1b as a novel gene rapidly induced by GnRH and a candidate to modulate gonadotropin secretion in rat gonadotropes.
Copyright © 2011 Elsevier Ireland Ltd. All rights reserved.
Figures
Similar articles
-
Annexin A1 is a novel target gene of gonadotropin-releasing hormone in LβT2 gonadotrope cells.J Vet Med Sci. 2018 Jan 27;80(1):116-124. doi: 10.1292/jvms.17-0569. Epub 2017 Dec 6. J Vet Med Sci. 2018. PMID: 29213013 Free PMC article.
-
Characterization of a MAPK scaffolding protein logic gate in gonadotropes.Mol Endocrinol. 2011 Jun;25(6):1027-39. doi: 10.1210/me.2010-0387. Epub 2011 Mar 24. Mol Endocrinol. 2011. PMID: 21436256 Free PMC article.
-
Induction of mPer1 expression by GnRH in pituitary gonadotrope cells involves EGR-1.Mol Cell Endocrinol. 2009 Nov 13;311(1-2):120-5. doi: 10.1016/j.mce.2009.07.005. Epub 2009 Jul 16. Mol Cell Endocrinol. 2009. PMID: 19616057
-
Welcoming beta-catenin to the gonadotropin-releasing hormone transcriptional network in gonadotropes.Mol Endocrinol. 2008 Jun;22(6):1295-303. doi: 10.1210/me.2007-0515. Epub 2008 Jan 24. Mol Endocrinol. 2008. PMID: 18218726 Free PMC article. Review.
-
PACAP modulates GnRH signaling in gonadotropes.Mol Cell Endocrinol. 2014 Mar 25;385(1-2):45-55. doi: 10.1016/j.mce.2013.09.029. Epub 2013 Oct 2. Mol Cell Endocrinol. 2014. PMID: 24095645 Review.
Cited by
-
GnRH Receptor Expression and Reproductive Function Depend on JUN in GnRH Receptor‒Expressing Cells.Endocrinology. 2018 Mar 1;159(3):1496-1510. doi: 10.1210/en.2017-00844. Endocrinology. 2018. PMID: 29409045 Free PMC article.
-
Paliperidone and aripiprazole differentially affect the strength of calcium-secretion coupling in female pituitary lactotrophs.Sci Rep. 2015 Mar 10;5:8902. doi: 10.1038/srep08902. Sci Rep. 2015. PMID: 25754735 Free PMC article.
-
Selection and Regulatory Network Analysis of Differential CircRNAs in the Hypothalamus of Goats with High and Low Reproductive Capacity.Int J Mol Sci. 2024 Sep 28;25(19):10479. doi: 10.3390/ijms251910479. Int J Mol Sci. 2024. PMID: 39408808 Free PMC article.
-
GnRH-A Key Regulator of FSH.Endocrinology. 2019 Jan 1;160(1):57-67. doi: 10.1210/en.2018-00889. Endocrinology. 2019. PMID: 30517625 Free PMC article. Review.
-
Gonadotropin regulation by pulsatile GnRH: Signaling and gene expression.Mol Cell Endocrinol. 2018 Mar 5;463:131-141. doi: 10.1016/j.mce.2017.10.015. Epub 2017 Nov 2. Mol Cell Endocrinol. 2018. PMID: 29102564 Free PMC article. Review.
References
-
- Kakar SS, Winters SJ, Zacharias W, Miller DM, Flynn S. Identification of distinct gene expression profiles associated with treatment of LbetaT2 cells with gonadotropin-releasing hormone agonist using microarray analysis. Gene. 2003;308:67–77. - PubMed
-
- Lawson MA, Tsutsumi R, Zhang H, Talukdar I, Butler BK, Santos SJ, Mellon PL, Webster NJ. Pulse sensitivity of the luteinizing hormone beta promoter is determined by a negative feedback loop Involving early growth response-1 and Ngfi-A binding protein 1 and 2. Mol Endocrinol. 2007;21:1175–91. - PMC - PubMed
-
- Wurmbach E, Yuen T, Ebersole BJ, Sealfon SC. Gonadotropin-releasing hormone receptor-coupled gene network organization. J Biol Chem. 2001;276:47195–201. - PubMed
-
- Wurmbach E, Yuen T, Sealfon SC. Focused microarray analysis. Methods. 2003;31:306–16. - PubMed
-
- Yuen T, Wurmbach E, Ebersole BJ, Ruf F, Pfeffer RL, Sealfon SC. Coupling of GnRH concentration and the GnRH receptor-activated gene program. Mol Endocrinol. 2002;16:1145–53. - PubMed
Publication types
MeSH terms
Substances
Grants and funding
LinkOut - more resources
Full Text Sources
Molecular Biology Databases
Miscellaneous
