. 2012 Aug 1;72(11):1159-70.
doi: 10.1002/pros.22465. Epub 2011 Nov 29.

Early growth response 1 and fatty acid synthase expression is altered in tumor adjacent prostate tissue and indicates field cancerization

Affiliations

Early growth response 1 and fatty acid synthase expression is altered in tumor adjacent prostate tissue and indicates field cancerization

Anna C Jones et al. Prostate. .

Abstract

Background: Field cancerization denotes the occurrence of molecular alterations in histologically normal tissues adjacent to tumors. In prostate cancer, identification of field cancerization has several potential clinical applications. However, prostate field cancerization remains ill defined. Our previous work has shown up-regulated mRNA of the transcription factor early growth response 1 (EGR-1) and the lipogenic enzyme fatty acid synthase (FAS) in tissues adjacent to prostate cancer.

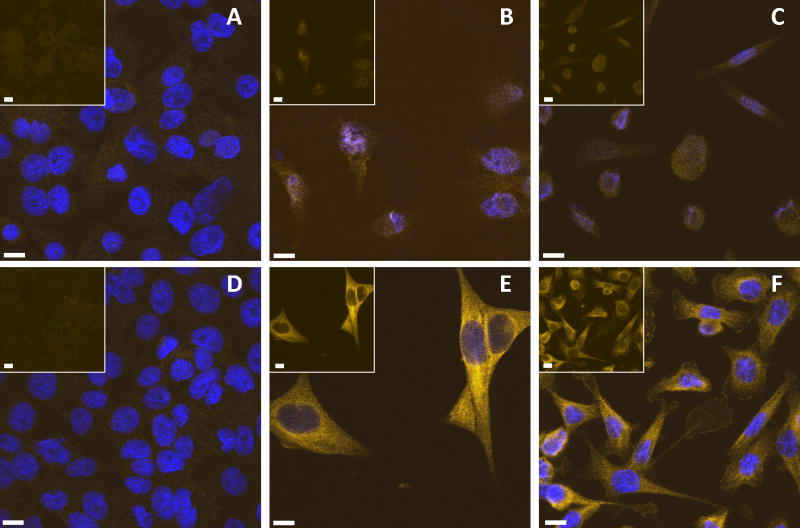
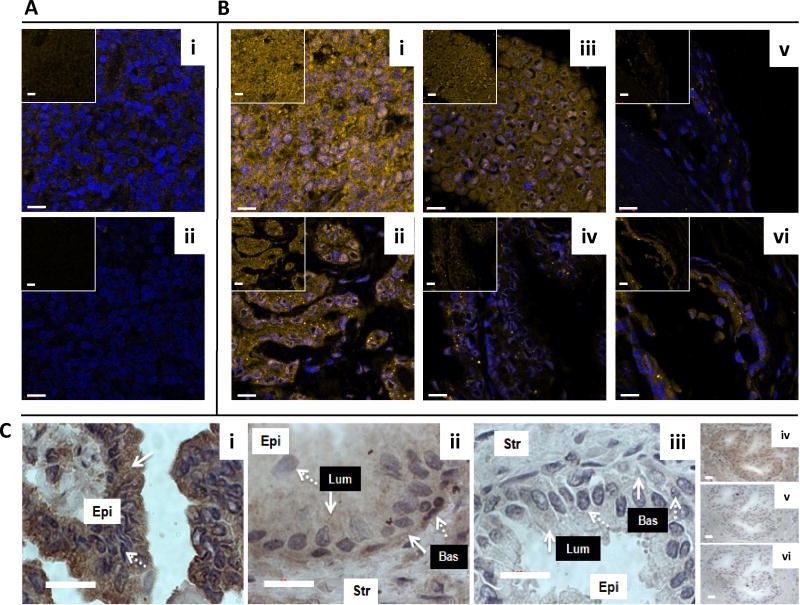
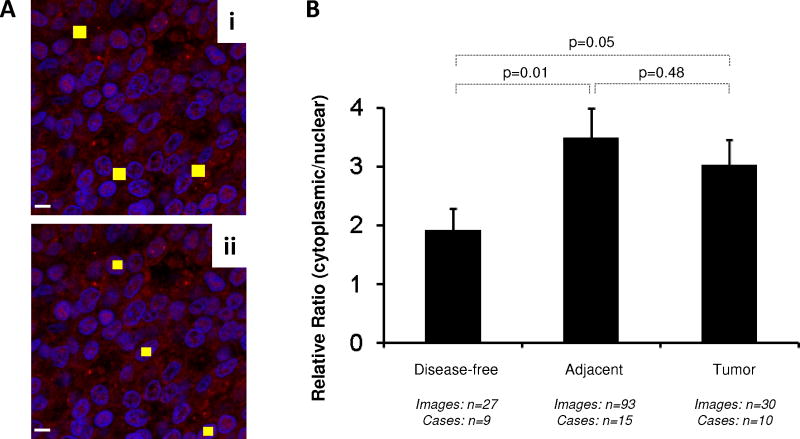
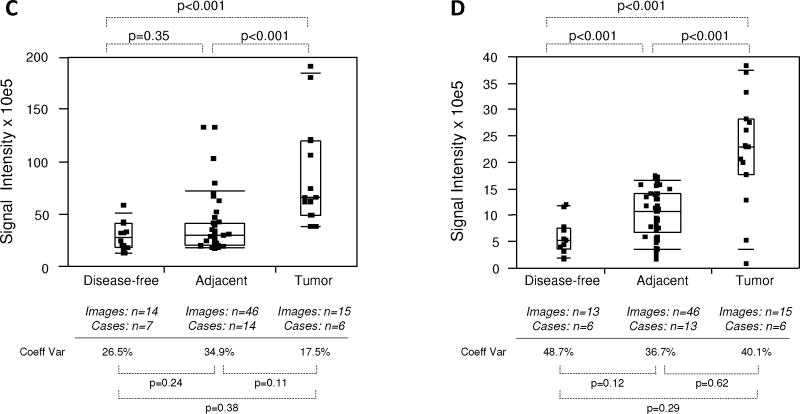
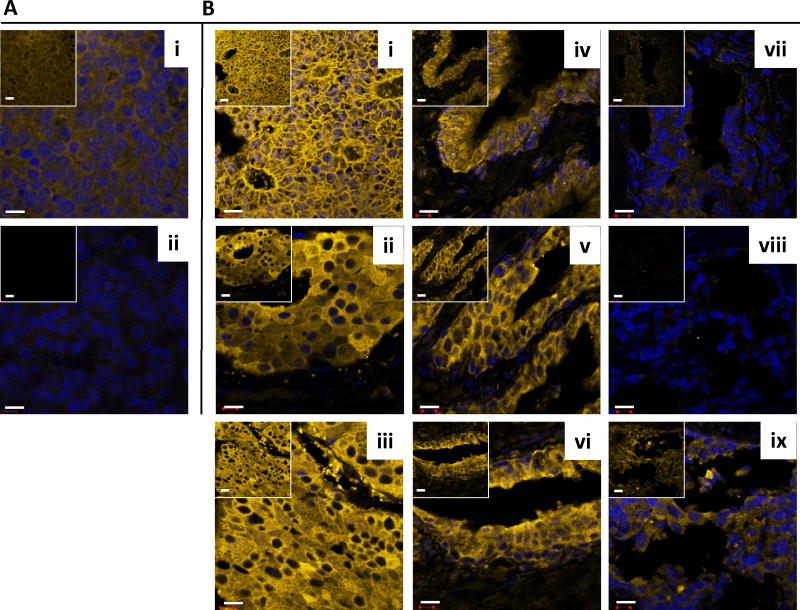
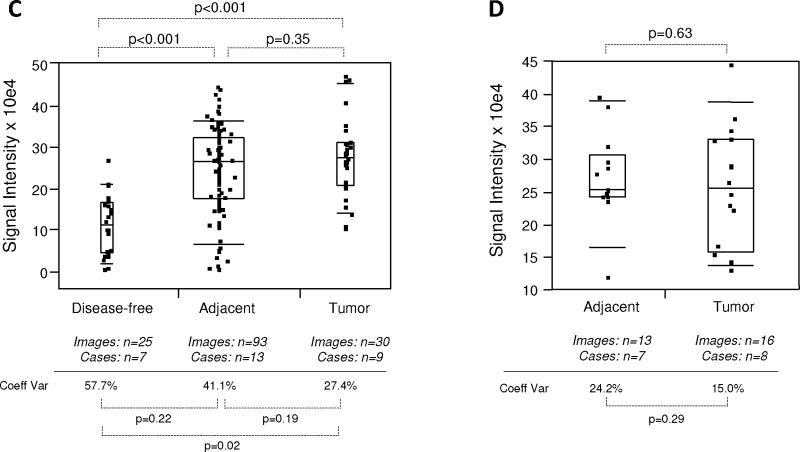
Methods: Immunofluorescence data were analyzed quantitatively by spectral imaging and linear unmixing to determine the protein expression levels of EGR-1 and FAS in human cancerous, histologically normal adjacent, and disease-free prostate tissues.

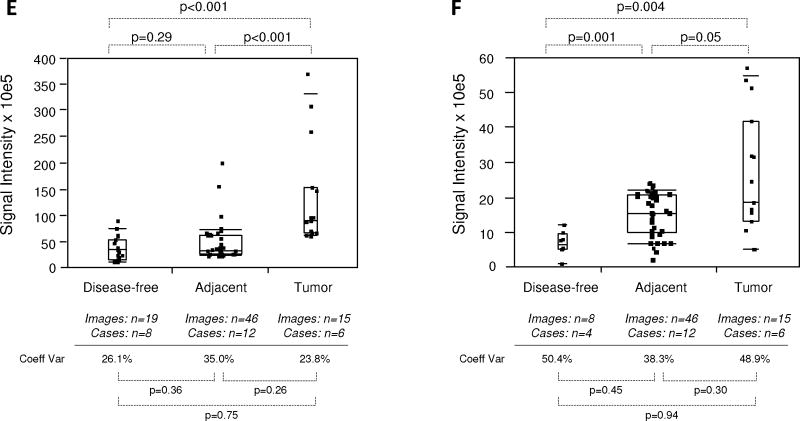
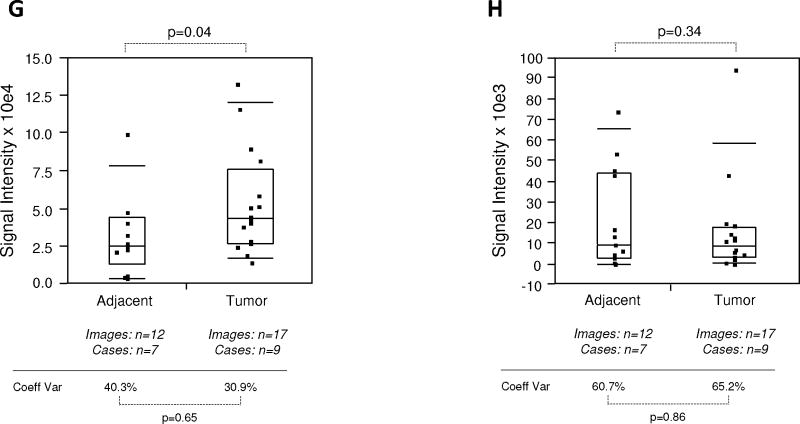
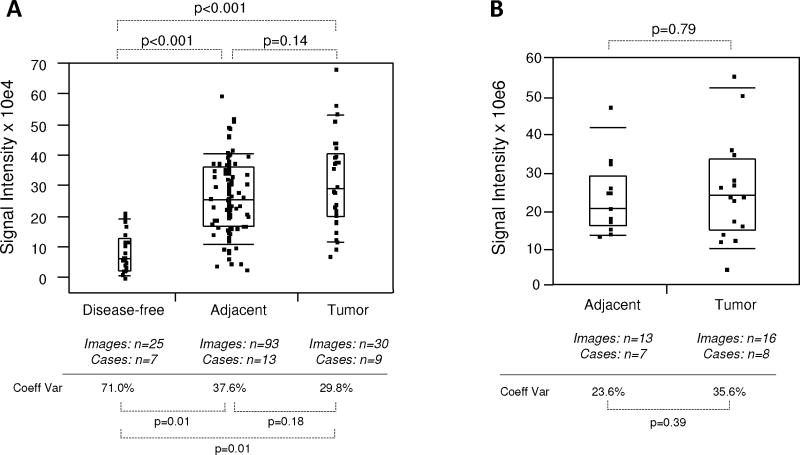
Results: EGR-1 expression was elevated in both structurally intact tumor adjacent (1.6× on average) and in tumor (3.0× on average) tissues compared to disease-free tissues. In addition, the ratio of cytoplasmic versus nuclear EGR-1 expression was elevated in both tumor adjacent and tumor tissues. Similarly, FAS expression was elevated in both tumor adjacent (2.7× on average) and in tumor (2.5× on average) compared to disease-free tissues.

Conclusions: EGR-1 and FAS expression is similarly deregulated in tumor and structurally intact adjacent prostate tissues and defines field cancerization. In cases with high suspicion of prostate cancer but negative biopsy, identification of field cancerization could help clinicians target areas for repeat biopsy. Field cancerization at surgical margins on prostatectomy specimen should also be looked at as a predictor of cancer recurrence. EGR-1 and FAS could also serve as molecular targets for chemoprevention.


Figures

Fig. 1
Fig. 1
EGR-1 (AC) and FAS (DF) immunostaining in BPH-1 (A and D), LNCaP (B and E), and PC-3 (C and F) cells by immunofluorescence; pictures represent overlays of nuclear staining by DAPI (blue) and Alexa Fluor 633 immunostaining (yellow/white); the insets in A and B are Alexa Fluor 633 immunostaining only; white bars in A–F represent 10 μM.
Fig. 2
Fig. 2
EGR-1 detection in human prostate tissues. Immunofluorescence with anti-EGR-1 antibody (A i) and with unspecific mouse IgG (A ii) in a tumor tissue of low EGR-1 expression; two cases of prostate tumors (B i,ii) and matched adjacent tissues (B iii,iv), as well as two cases of disease-free control tissues unrelated to cancer (B v–vi) are shown; pictures represent overlays of nuclear staining by DAPI (blue) and Alexa Fluor 633 immunostaining (yellow/white); the insets in A and B are Alexa Fluor 633 immunostaining only; white bars in A and B represent 10 μM. C: Chromagen immunohistochemistry for EGR-1 in tumor (C i), matched adjacent (C ii), and disease-free unrelated to cancer (C iii) prostate tissue; solid and dashed white arrows indicate cytoplasmic and nuclear staining areas, respectively; white boxes denote epithelial (Epi) and stromal (Str) compartments; black boxes denote luminal (Lum) and basal (Bas) cell layers within the epithelial compartments; (C iv–vi) Antibody controls in an adjacent tissue: Anti-EGR-1 antibody (C iv) compared to unspecific IgG (C v) compared to anti-EGR-1 antibody pre-absorbed with matching peptide (Cvi); white bars in C represent 20 μM.
Fig. 3
Fig. 3
FAS detection in human prostate tissues. Immunofluorescence with anti-FAS antibody (A i) and with unspecific rabbit IgG (A ii) in a tumor tissue of low FAS expression; three cases of prostate tumors (B i–iii) and matched adjacent tissues (B iv–vi), as well as three cases of disease-free control tissues unrelated to cancer (B vii–ix) are shown; pictures represent overlays of nuclear staining by DAPI (blue) and Alexa Fluor 633 immunostaining (yellow/white); the insets are Alexa Fluor 633 immunostaining only; white bars represent 10 μM.
Fig. 3
Fig. 3
FAS detection in human prostate tissues. Immunofluorescence with anti-FAS antibody (A i) and with unspecific rabbit IgG (A ii) in a tumor tissue of low FAS expression; three cases of prostate tumors (B i–iii) and matched adjacent tissues (B iv–vi), as well as three cases of disease-free control tissues unrelated to cancer (B vii–ix) are shown; pictures represent overlays of nuclear staining by DAPI (blue) and Alexa Fluor 633 immunostaining (yellow/white); the insets are Alexa Fluor 633 immunostaining only; white bars represent 10 μM.
Fig. 4
Fig. 4
Quantitative immunofluorescence of EGR-1 in human prostate tissues. A: Representative example of regions of interest (ROI) placement (yellow boxes) in a tumor tissue of low EGR-1 expression to quantify cytoplasmic (A i) and nuclear (A ii) EGR-1 expression (red); white bars represent 10 μM. B: Relative cytoplasmic/nuclear expression ratios in disease-free, tumor adjacent, and tumor tissues; bars indicate the mean ± standard error for the number of images and cases indicated; P-values indicate the level of statistical significance for the differences between groups (Student’s t-test).CH: EGR-1expression levels (indicated as signal intensities (pixel count)) in disease-free, tumor adjacent, and tumor tissues; the types of analysis were the following (as per Materials and Methods): (C and D) Whole slide analysis (WSA) for cytoplasmic expression above and below the median for the cohort from UNMH/CHTN, respectively; (E and F) WSA for nuclear expression above and below the median for the cohort from UNMH/CHTN, respectively; (G and H) WSA for cytoplasmic and nuclear expression in the tissue microarray (TMA), respectively; individual data points are shown as small black squares (partially overlapping); the boxes represent group medians (line across middle) and quartiles (25th and 75th percentiles) at its ends; lines above and below boxes indicate 10th and 90th percentiles, respectively; the width of the boxes relates to the number of data points; for each analysis, the number of images and cases is indicated; P-values above the panels denote the level of statistical significance for the differences between groups, as calculated by the Wilcoxon rank sums test; intra-tissue heterogeneity is indicated below the panels by the coefficient of variation in % (Coeff Var); the level of statistical significance for the differences between groups is indicated by the P-values(Student’s t-test).
Fig. 5
Fig. 5
Quantitative immunofluorescence of FAS in human prostate tissues. AD: FAS expression levels (indicated as signal intensities (pixel count)) in disease-free, tumor adjacent, and tumor tissues; the types of analysis were the following (as per Materials and Methods section and Table I): (A and B) Whole slide analysis (WSA) for the cohort from UNMH/CHTN and from the tissue microarray, respectively; (C and D) regions of interest (ROI) analysis for the cohort from UNMH/CHTN and from the tissue microarray, respectively; individual data points are shown as small black squares (partially overlapping); the boxes represent group medians (line across middle) and quartiles (25th and 75th percentiles) at its ends; lines above and below boxes indicate 10th and 90th percentiles, respectively; the width of the boxes relates to the number of data points; for each analysis, the number of images and cases is indicated; P-values above the panels denote the level of statistical significance for the differences between groups, as calculated by the Wilcoxon rank sums test; intra-tissue heterogeneity is indicated below the panels by the coefficient of variation in % (Coeff Var); the level of statistical significance for the differences between groups is indicated by the P-values (Student’s t-test).
Fig. 5
Fig. 5
Quantitative immunofluorescence of FAS in human prostate tissues. AD: FAS expression levels (indicated as signal intensities (pixel count)) in disease-free, tumor adjacent, and tumor tissues; the types of analysis were the following (as per Materials and Methods section and Table I): (A and B) Whole slide analysis (WSA) for the cohort from UNMH/CHTN and from the tissue microarray, respectively; (C and D) regions of interest (ROI) analysis for the cohort from UNMH/CHTN and from the tissue microarray, respectively; individual data points are shown as small black squares (partially overlapping); the boxes represent group medians (line across middle) and quartiles (25th and 75th percentiles) at its ends; lines above and below boxes indicate 10th and 90th percentiles, respectively; the width of the boxes relates to the number of data points; for each analysis, the number of images and cases is indicated; P-values above the panels denote the level of statistical significance for the differences between groups, as calculated by the Wilcoxon rank sums test; intra-tissue heterogeneity is indicated below the panels by the coefficient of variation in % (Coeff Var); the level of statistical significance for the differences between groups is indicated by the P-values (Student’s t-test).

Similar articles

Cited by

References

    1. Mackinnon AC, Yan BC, Joseph LJ, Al-Ahmadie HA. Molecular biology underlying the clinical heterogeneity of prostate cancer: An update. Arch Pathol Lab Med. 2009;133(7):1033–1040. - PubMed
    1. Andreoiu M, Cheng L. Multifocal prostate cancer: Biologic, prognostic, and therapeutic implications. Hum Pathol. 2010;41(6):781–793. - PubMed
    1. Epstein JI. Mimickers of prostatic intraepithelial neoplasia. Int J Surg Pathol. 2010;18(3 Suppl):142S–148S. - PubMed
    1. De Marzo AM, Platz EA, Sutcliffe S, Xu J, Gronberg H, Drake CG, Nakai Y, Isaacs WB, Nelson WG. Inflammation in prostate carcinogenesis. Nat Rev Cancer. 2007;7(4):256–269. - PMC - PubMed
    1. Sarkar FH, Li Y, Wang Z, Kong D. Novel targets for prostate cancer chemoprevention. Endocr Relat Cancer. 2010;17(3):R195–212. - PMC - PubMed

Publication types

MeSH terms

Substances