Review
. 2011;35 Suppl 1(Suppl 1):S12-7.
doi: 10.1002/gepi.20643.

Statistical analysis of rare sequence variants: an overview of collapsing methods

Affiliations
Review

Statistical analysis of rare sequence variants: an overview of collapsing methods

Carmen Dering et al. Genet Epidemiol. 2011.

Abstract

With the advent of novel sequencing technologies, interest in the identification of rare variants that influence common traits has increased rapidly. Standard statistical methods, such as the Cochrane-Armitage trend test or logistic regression, fail in this setting for the analysis of unrelated subjects because of the rareness of the variants. Recently, various alternative approaches have been proposed that circumvent the rareness problem by collapsing rare variants in a defined genetic region or sets of regions. We provide an overview of these collapsing methods for association analysis and discuss the use of permutation approaches for significance testing of the data-adaptive methods.


Figures

Fig. 1
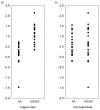
Fig. 1. Failure of standard permutation methods
Consider an autosomal SNP with an allele frequency of 0.7 and a recessive genetic model for the A allele. The phenotype is assumed to be normally distributed. (a) Two genotype groups in the original sample differ in their means but the variances are identical. The assumptions of the standard t-test are met. (b) One permutation sample of the same data as in panel (a) is shown. Note that the permuted data are not unimodal and that, although the variances in the permuted sample are similar for both genotype groups, the group-specific permutation variance is substantially larger than the group-specific variance in the original sample. In fact, the standard two-sided t-test yields p = 0.03, whereas the Madsen and Browning permutation approach with 1,000 permutations gives p = 0.23 and the standard permutation approach, also with 1,000 permutations, results in p = 0 because none of the permuted samples reveal a t statistic larger than the original data. As a result, the Madsen and Browning permutation approach leads to a different conclusion compared with the standard t test. Furthermore, the classical permutation method most likely yields p = 0, even for a high number of permutations, and thus underestimates the p-value.

Similar articles

Cited by

References

    1. Asimit J, Zeggini E. Rare variant association analysis methods for complex traits. Annu Rev Genet. 2010;44:293–308. - PubMed
    1. Bansal V, Libiger O, Torkamani A, Schork NJ. Statistical analysis strategies for association studies involving rare variants. Nat Rev Genet. 2010;11(11):773–85. - PMC - PubMed
    1. Bromberg Y, Yachdav G, Rost B. SNAP predicts effect of mutations on protein function. Bioinformatics. 2008;24(20):2397–8. - PMC - PubMed
    1. Cordell HJ. Genome-wide association studies: Detecting gene-gene interactions that underlie human diseases. Nat Rev Genet. 2009;10(6):392–404. - PMC - PubMed
    1. Easton DF, Deffenbaugh AM, Pruss D, Frye C, Wenstrup RJ, Allen-Brady K, Tavtigian SV, Monteiro AN, Iversen ES, Couch FJ, et al. A systematic genetic assessment of 1,433 sequence variants of unknown clinical significance in the BRCA1 and BRCA2 breast cancer-predisposition genes. Am J Hum Genet. 2007;81(5):873–83. - PMC - PubMed

Publication types

LinkOut - more resources