. 2011 Nov;23(11):3992-4012.
doi: 10.1105/tpc.111.091033. Epub 2011 Nov 29.

Evidence for a SAL1-PAP chloroplast retrograde pathway that functions in drought and high light signaling in Arabidopsis

Affiliations

Evidence for a SAL1-PAP chloroplast retrograde pathway that functions in drought and high light signaling in Arabidopsis

Gonzalo M Estavillo et al. Plant Cell. 2011 Nov.

Abstract

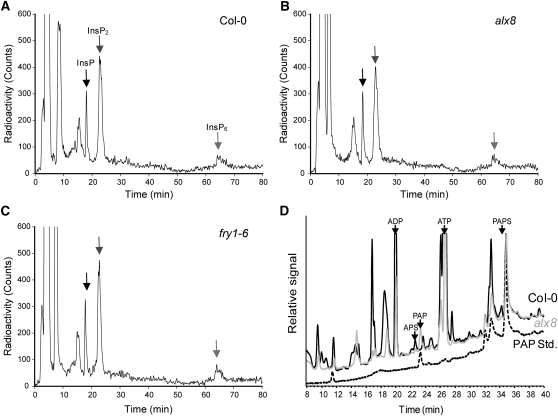
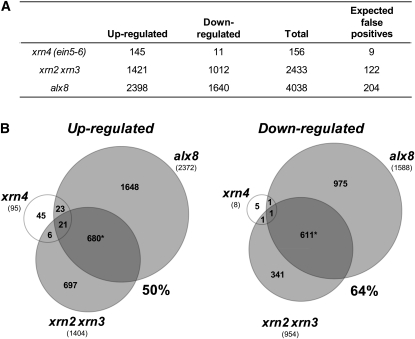
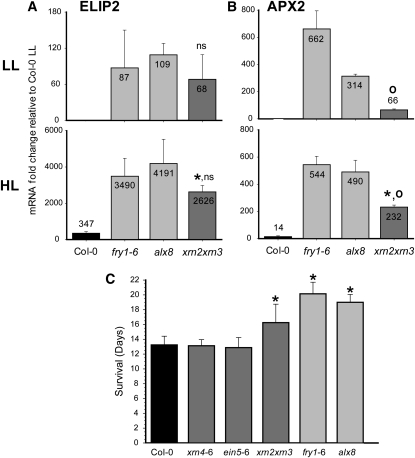
Compartmentation of the eukaryotic cell requires a complex set of subcellular messages, including multiple retrograde signals from the chloroplast and mitochondria to the nucleus, to regulate gene expression. Here, we propose that one such signal is a phosphonucleotide (3'-phosphoadenosine 5'-phosphate [PAP]), which accumulates in Arabidopsis thaliana in response to drought and high light (HL) stress and that the enzyme SAL1 regulates its levels by dephosphorylating PAP to AMP. SAL1 accumulates in chloroplasts and mitochondria but not in the cytosol. sal1 mutants accumulate 20-fold more PAP without a marked change in inositol phosphate levels, demonstrating that PAP is a primary in vivo substrate. Significantly, transgenic targeting of SAL1 to either the nucleus or chloroplast of sal1 mutants lowers the total PAP levels and expression of the HL-inducible ASCORBATE PEROXIDASE2 gene. This indicates that PAP must be able to move between cellular compartments. The mode of action for PAP could be inhibition of 5' to 3' exoribonucleases (XRNs), as SAL1 and the nuclear XRNs modulate the expression of a similar subset of HL and drought-inducible genes, sal1 mutants accumulate XRN substrates, and PAP can inhibit yeast (Saccharomyces cerevisiae) XRNs. We propose a SAL1-PAP retrograde pathway that can alter nuclear gene expression during HL and drought stress.


Figures

Figure 1.
Figure 1.
SAL1 Colocalizes in the Vascular Tissue with H2O2. (A) Stable expression of the SAL1-GFP fusion protein in Arabidopsis plants. Gene expression was driven by a genomic sequence containing the endogenous SAL1 promoter, which was fused to GFP (pSAL1:SAL1:GFP). Top panel: 8-d leaf showing a strong GFP signal in the vascular tissue and a more moderate one in the mesophyll tissues. The bottom left image is GFP channel, middle image is chlorophyll channel, and right image shows the overlay from a 2-week-old leaf. (B) Visualization of H2O2 in Col-0 and alx8 leaves after 1 h HL treatment using DAB. H2O2 accumulation is visualized as a dark, brown precipitate. (C) Quantification of leaf H2O2 in 6-week-old, soil-grown Col-0 and alx8. After extraction and incubation with the Amplex Red, the amount of H2O2 was quantified against a standard curve and normalized to the FW. The mean and sd are shown. Asterisk indicates significant difference relative to Col-0 (t test, P < 0.05, n = 5).
Figure 2.
Figure 2.
PAP, and Not IPs, Accumulates in alx8. (A) to (C) Analyses of phosphoinositols in different genotypes. Five to six 10-d-old Col-0 (A), alx8 (B), or fry1-6 (C) seedlings were labeled with myo-[2-3H]inositol for 72 h and IPs extracted in HCl prior to separation by HPLC. Chromatograms show representative profile of phosphoinositols of one of two independent experiments. The intensity and periodicity of the peaks corresponding to inositol mono-, bis-, and hexakisphosphate (arrows) are similar in all genotypes. (D) Isolation and identification of phosphoadenosine nucleotides. Metabolites were extracted from leaves of 30-d-old plants and adenosines fluorescently labeled by derivatization. PAPS, APS, and PAP in wild-type Col-0 (black) and alx8 (gray) were identified by coelution with external PAP standard (dashed black line). A typical chromatogram is shown. Note that approximately fourfold less extract of alx8 than Col-0 was injected in this experiment. Quantification was undertaken using a standard curve (see Supplemental Figure 4 online).
Figure 3.
Figure 3.
PAP Accumulates during Drought in Arabidopsis. (A) Correlation between RWC of plants and PAP concentration on a dry weight (DW) basis ± sd (n > 8) during drought. The day in drought is indicated in italics. Measurements performed as in Figure 2 and Supplemental Figure 4 online. Data were fitted to exponential curves, and results are shown in the table (R2, correlation coefficient). ANOVA two-factor analyses indicated a highly significant difference for day × genotype for RWC and PAP (P < 0.005). (B) Images of representative plants harvested for the PAP measurements performed in (A).
Figure 4.
Figure 4.
SAL1 Accumulates in the Chloroplasts and Mitochondria of Arabidopsis. (A) Transient expression of 35S:SAL1:GFP in Arabidopsis cells. The full-length cDNA encoding SAL1 was fused in frame with GFP and cotransformed into Arabidopsis cells with either mitochondrial-targeted RFP (AOX-RFP) or plastid-targeted RFP (SSU-RFP). (B) Stable expression of the SAL1:SAL1:GFP fusion in Arabidopsis leaf mesophyll protoplasts. The endogenous SAL1 promoter was fused to the SAL1 genomic sequence (pSAL1:SAL1:GFP) and transformed into Col-0 plants. The same construct transformed into sal1 mutants complemented all analyzed sal1 phenotypes (Hirsch et al., 2011). The SAL1:GFP pattern was identical for several independent transgenic lines in the Col-0 background. White arrows indicate mitochondria. Bars = 12 μm. (C) Chloroplastic and cytosolic fractions were isolated from Col-0 protoplasts, while mitochondria were purified from seedlings using free-flow electrophoresis. Five micrograms of total protein was loaded per sample and subjected to immunoblots with polyclonal antibodies against SAL1 (Wilson et al., 2009) and other cellular markers. (D) Detection of PAP in isolated Col-0 chloroplasts. Col-0 chloroplasts isolated using a Percoll gradient and assayed for PAP. The PAP peak for both the chloroplast extract and the PAP standard is indicated with an arrow.
Figure 5.
Figure 5.
PAP Levels Can Be Lowered by Nuclear or Chloroplastic Targeting of SAL1. (A) Schematic representations of the SAL1 gene, mutant alleles, and constructs used to transform the corresponding genotypes. White boxes represent the mature protein, while the gray ones represent the transit peptides. The reported cellular location is indicated (C, chloroplast; M, mitochondria, N, nucleus; −, no SAL1 protein). Bar graphs represent the average PAP concentrations from leaf tissue in pmol/mg FW ± sd (n = 5). Asterisk indicates significant difference relative to Col-0, and “°” indicates significant difference to alx8. ns, not significant (t test; P < 0.01). (B) Correlation between PAP levels and APX2 expression. The PAP concentration of 26-d-old plants was plotted versus the logarithm of the fold change of APX2 mRNA relative to Col-0. Four biological replicates were run for Col-0, alx8, and fou8 and six for fou8+SSU:ScSAL1. (A) and (B) show results from two different experiments. For PAP, asterisk indicates significant difference relative to Col-0, and “°” indicates significant difference to alx8 or fou8. ns, not significant (t test; P < 0.01). For APX2 mRNA, “#” indicates significant difference relative to Col-0, and “^” indicates significant difference to alx8 or fou8. ns, not significant (t test; P < 0.01). (C) Schematic representation of the effect of SAL1 cellular localization on PAP levels and APX2 expression summarizing the results presented in Table 2 and (A) and (B). Shaded compartments indicate the location of SAL1 protein in each of the germplasms.
Figure 6.
Figure 6.
SAL1 and Nuclear XRNs Regulate a Large Subset of Genes. (A) Summary table of transcriptome changes in xrn4, xrn2 xrn3, and alx8 mutants. Total number of genes whose transcripts were significantly different in abundance by >1.5-fold in each mutant compared with Col-0 after FDR correction at PPDE (>P) > 0.95 (95% confidence interval). Expected false positives at this FDR cutoff level are also indicated. (B) Venn diagrams showing the overlap of changes in gene expression relative to Col-0 (>1.5-fold) between alx8, xrn2 xrn3, and xrn4. Numbers in the Venn diagrams indicate transcripts that are significantly (PPDE [>P] > 0.95) up- or downregulated in the mutant genotype compared with Col-0. The percentage of genes in xrn2 xrn3 that are regulated in the same manner as in alx8 is given. The number of genes that significantly change excluding antagonistic changes is given in parentheses (see Supplemental Figure 8 online). Asterisk indicates significantly (P < 0.02) more transcripts overlapping than expected by chance according to a χ2 test.
Figure 7.
Figure 7.
Heat Map of Genes Coregulated in both alx8 and xrn2 xrn3 Mutants. Heat map of genes upregulated (A) and downregulated (B) threefold or more in both genotypes compared with their regulation in response to abiotic stress and chemical treatments (Hruz et al., 2008).
Figure 8.
Figure 8.
Light-Induced Gene Regulation and Drought Tolerance Is Similar in sal1 and xrn2 xrn3 Double Mutants. (A) Expression levels of ELIP2 after LL and HL. (B) Expression levels of APX2 after LL and HL. For both (A) and (B), the transcript levels were quantified by real-time PCR for both alx8 and xrn2 xrn3 mutants plants grown under standard growth conditions and after 1 h of HL stress (~1500 μmol m−2 s−1). The bars represent the average of the fold change compared with that of the wild type ± sd (n = 3). For xrn2 xrn3, “°” and ns indicate significant or no significant difference, respectively, relative to sal1 mutants (t test; P < 0.05). For HL, asterisk indicates significant difference relative to Col-0 HL (t test; P < 0.05). (C) Survival time of plants during drought calculated as described by Woo et al. (2008). Periodic measurements of the maximum efficiency of photosystem II (Fv/Fm) using chlorophyll fluorescence were recorded during drought and used to calculate plant survival. Bar graphs represent the average survival time as measured in days ± sd (n > 7). Asterisk indicates significant difference relative to Col-0 (t test; P < 0.001).
Figure 9.
Figure 9.
Proposed Model for a SAL1-PAP Retrograde Signaling Pathway. PAP levels are negatively regulated by the chloroplastic SAL1 phosphatase (Figures 2 to 5). Upon environmental stresses, such as HL and drought, PAP levels increase (Figure 3). PAP can move between cellular compartments as evidenced by the complementation studies (Figure 5). Elevated PAP levels likely inhibit XRNs in the cytosol and nucleus. Nuclear XRN inhibition causes similar changes in expression to sal1 mutants, such as ELIP2 and APX2, and a degree of drought tolerance (Figures 6 to 8, Table 3). [See online article for color version of this figure.]

Comment in

Similar articles

Cited by

References

    1. Albrecht V., Simková K., Carrie C., Delannoy E., Giraud E., Whelan J., Small I.D., Apel K., Badger M.R., Pogson B.J. (2010). The cytoskeleton and the peroxisomal-targeted snowy cotyledon3 protein are required for chloroplast development in Arabidopsis. Plant Cell 22: 3423–3438 - PMC - PubMed
    1. Allison D.B., Cui X., Page G.P., Sabripour M. (2006). Microarray data analysis: From disarray to consolidation and consensus. Nat. Rev. Genet. 7: 55–65 - PubMed
    1. Aronsson H., Jarvis P. (2002). A simple method for isolating import-competent Arabidopsis chloroplasts. FEBS Lett. 529: 215–220 - PubMed
    1. Baldi P., Long A.D. (2001). A Bayesian framework for the analysis of microarray expression data: Regularized t -test and statistical inferences of gene changes. Bioinformatics 17: 509–519 - PubMed
    1. Ball L., Accotto G.-P., Bechtold U., Creissen G., Funck D., Jimenez A., Kular B., Leyland N., Mejia-Carranza J., Reynolds H., Karpinski S., Mullineaux P.M. (2004). Evidence for a direct link between glutathione biosynthesis and stress defense gene expression in Arabidopsis. Plant Cell 16: 2448–2462 - PMC - PubMed

Publication types

MeSH terms