Review
. 2012 Mar;85(1011):197-207.
doi: 10.1259/bjr/47213729. Epub 2011 Nov 29.

Pearls and pitfalls in breast MRI

Affiliations
Review

Pearls and pitfalls in breast MRI

I Millet et al. Br J Radiol. 2012 Mar.

Abstract

At our academic institution, we have noticed repeated examples of both false-positive and false-negative MR diagnoses in breast cancer. The most common diagnostic errors in interpreting MRI of the breast are discussed in this review and experience-based advice is provided to avoid similar mistakes. The most common reasons for false-positive diagnoses are misinterpretation of artefacts, confusion between normal enhancing structures and tumours and, above all, insufficient use of the American College of Radiology breast imaging reporting and data system lexicon, whereas false-negative diagnoses are made as a result of missed tiny enhancement, a background-enhancing breast, or enhancement interpreted as benign rather than malignant.


Figures

Figure 1
Figure 1
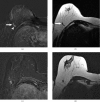
Pseudo-enhancement due to a subtraction artefact. (a) At level “a”, a pseudo-enhancement is seen on the subtraction image due to subtraction between a mass in hypersignal on the (b) axial fat-saturated T1 weighted image after contrast and the fat in hyposignal on the (c) axial fat-saturated T1 weighted image before contrast. (d) At level “b”, 6 mm lower, the feature is inverted with a hyposignal on the subtraction image due to subtraction between fat in hyposignal on the (e) axial fat-saturated T1 weighted image after contrast and the mass in hypersignal on the (f) axial fat-saturated T1 weighted image before contrast. Pseudo-enhancement of the mass is due to its movement in a coronal plane between sequences before and after intravenous contrast.
Figure 2
Figure 2
Normal enhancing breast structures. (a) On the subtracted axial image of the left breast, four enhancing structures are seen: two are linear and two are nodular. (b) On the T2 weighted image, the two nodules have a location within fat and a hypersignal highly suggestive of lymph nodes, and the two linear structures are suggestive of vessels with one in hypersignal (arrow) and the other in hyposignal (double arrows) because of a difference in velocities.
Figure 3
Figure 3
Invasive breast cancer with morphological findings better seen on native images. (a) On the subtracted axial slice, the outline of the enhancement is hardly analysable. (b) On the T2 weighted image, the stellar outline of the mass is obvious.
Figure 4
Figure 4
Rim of enhancement around a fat necrosis. (a) Axial subtracted image from the dynamic T1 weighted series: non-mass enhancement corresponding to an invasive breast cancer. 1 year after conservative treatment, (b) subtracted and (c) T2 weighted axial images. A rim enhancement is seen around the fat necrosis. Note also that the retraction of skin is clearly seen on the T2 weighted sequence.
Figure 5
Figure 5
Hypersignal on a T2 weighted sequence in invasive ductal carcinoma. (a) Axial T2 weighted image showing a circumscribed tumour with a central region of high signal intensity. (b) Axial subtraction image showing thick and irregular enhancement surrounding a hypointense area corresponding to necrosis within the tumour.
Figure 6
Figure 6
Thick enhanced rim around a cyst. (a) Axial subtraction image showing a thick and regular enhanced rim around a hyposignal area. (b) On the axial T2 weighted image and (c) on the axial fat-saturated T1 weighted image, the non-enhanced area has a high signal intensity suggesting a cyst, which was confirmed by ultrasound.
Figure 7
Figure 7
Regional non-mass-like enhancement in fibrocystic change of the breast. (a) Axial subtraction shows a non-mass enhancement on the outer part of the right breast. (b) Axial T2 weighted image showing numerous cysts within the enhanced area. Note also cysts in the inner part of the breast close to the pectoralis muscle.
Figure 8
Figure 8
Clinically palpable breast cancer in the left axillary area with no enhancement on MRI. (a) Axial subtraction image does not show any enhanced mass in the axillary area. (b) Axial T2 weighted image clearly shows a high signal intensity mass with irregular margins, corresponding to the palpable breast cancer (arrow). (c) On CT examination performed for breast cancer staging, the mass is paradoxically enhanced and clearly seen in the outer part of the breast (arrow).
Figure 9
Figure 9
True linear enhancement due to a ductal carcinoma in situ (DCIS) close to a pseudo-enhancement due to an artefact. (a) Axial subtraction showing two enhancements: a rim enhancement (arrow) and a linear enhancement (double arrows). Note a dark nodule behind the rim enhancement suggestive of an artefact (arrowhead). The comparison between axial native T1 weighted images (b) before and (c) after contrast showing that only the linear enhancement is true, the nodule in hyposignal is not truly enhanced and the pseudo-enhancement is due to a subtraction artefact. Biopsy of the linear enhancement under MRI guidance showed a DCIS.
Figure 10
Figure 10
Missed breast cancer in a female with risk factors. (a) Axial subtraction showing an enhanced mass (arrow) close to a vessel (arrowhead). (b) The hypointense mass is clearly seen (arrow) on the axial T2 weighted image. However, this mass was missed. 1 year later, the mass had grown and was well individualised on both (c) axial subtraction and (d) axial T2 weighted images.
Figure 11
Figure 11
Breast cancer with non-enhancing septa. Axial subtraction showing an enhanced mass with non-enhancing septa. Note that the mass margins are irregular. The mass was biopsied under ultrasound guidance with a diagnosis of invasive breast cancer.

References

    1. Saslow D, Boetes C, Burke W, Harms S, Leach MO, Lehman CD, et al. American Cancer Society guidelines for breast screening with MRI as an adjunct to mammography. CA Cancer J Clin 2007;57:75–89 Erratum in: CA Cancer J Clin 2007; 57: 185 - PubMed
    1. Mann RM, Kuhl CK, Kinkel K, Boetes C. Breast MRI: guidelines from the European Society of Breast Imaging. Eur Radiol 2008;18:1307–18 - PMC - PubMed
    1. Liberman L, Morris EA, Dershaw DD, Abramson AF, Tan LK. MR imaging of the ipsilateral breast in women with percutaneously proven breast cancer. AJR Am J Roentgenol 2003;180:901–10 - PubMed
    1. Kuhl CK, Schmutzler RK, Leutner CC, Kempe A, Wardelmann E, Hocke A, et al. Breast MR imaging screening in 192 women proved or suspected to be carriers of a breast cancer susceptibility gene: preliminary results. Radiology 2000;215:267–79 - PubMed
    1. Warner E, Plewes DB, Shumak RS, Catzavelos GC, Di Prospero LS, Yaffe MJ, et al. Comparison of breast magnetic resonance imaging, mammography, and ultrasound for surveillance of women at high risk for hereditary breast cancer. J Clin Oncol 2001;19:3524–31 - PubMed